Fig. B.1.
Download original image
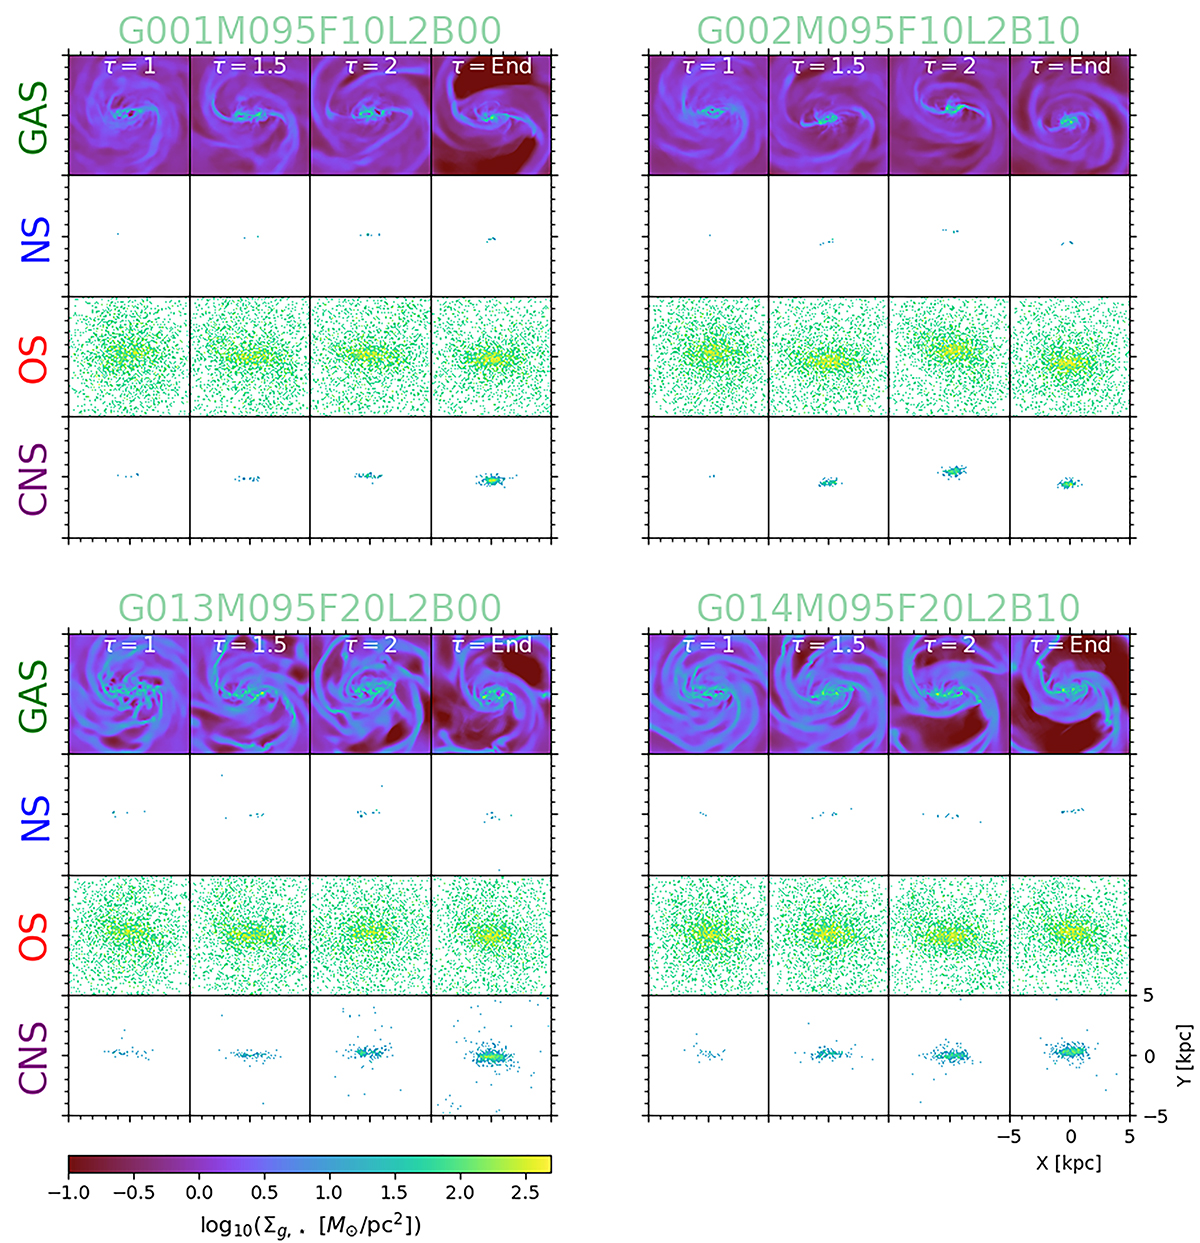
Time evolution as a function of τ of the gas surface density (top row, GAS), formed stars’ surface density (second row, NS), old stars’ surface density (third row, OS), and cumulative formed stars’ surface density (bottom row, CNS) of the four lowest stellar mass models (109.5 M⊙). Each panel shows a box with a side length of 10 kpc.
Current usage metrics show cumulative count of Article Views (full-text article views including HTML views, PDF and ePub downloads, according to the available data) and Abstracts Views on Vision4Press platform.
Data correspond to usage on the plateform after 2015. The current usage metrics is available 48-96 hours after online publication and is updated daily on week days.
Initial download of the metrics may take a while.