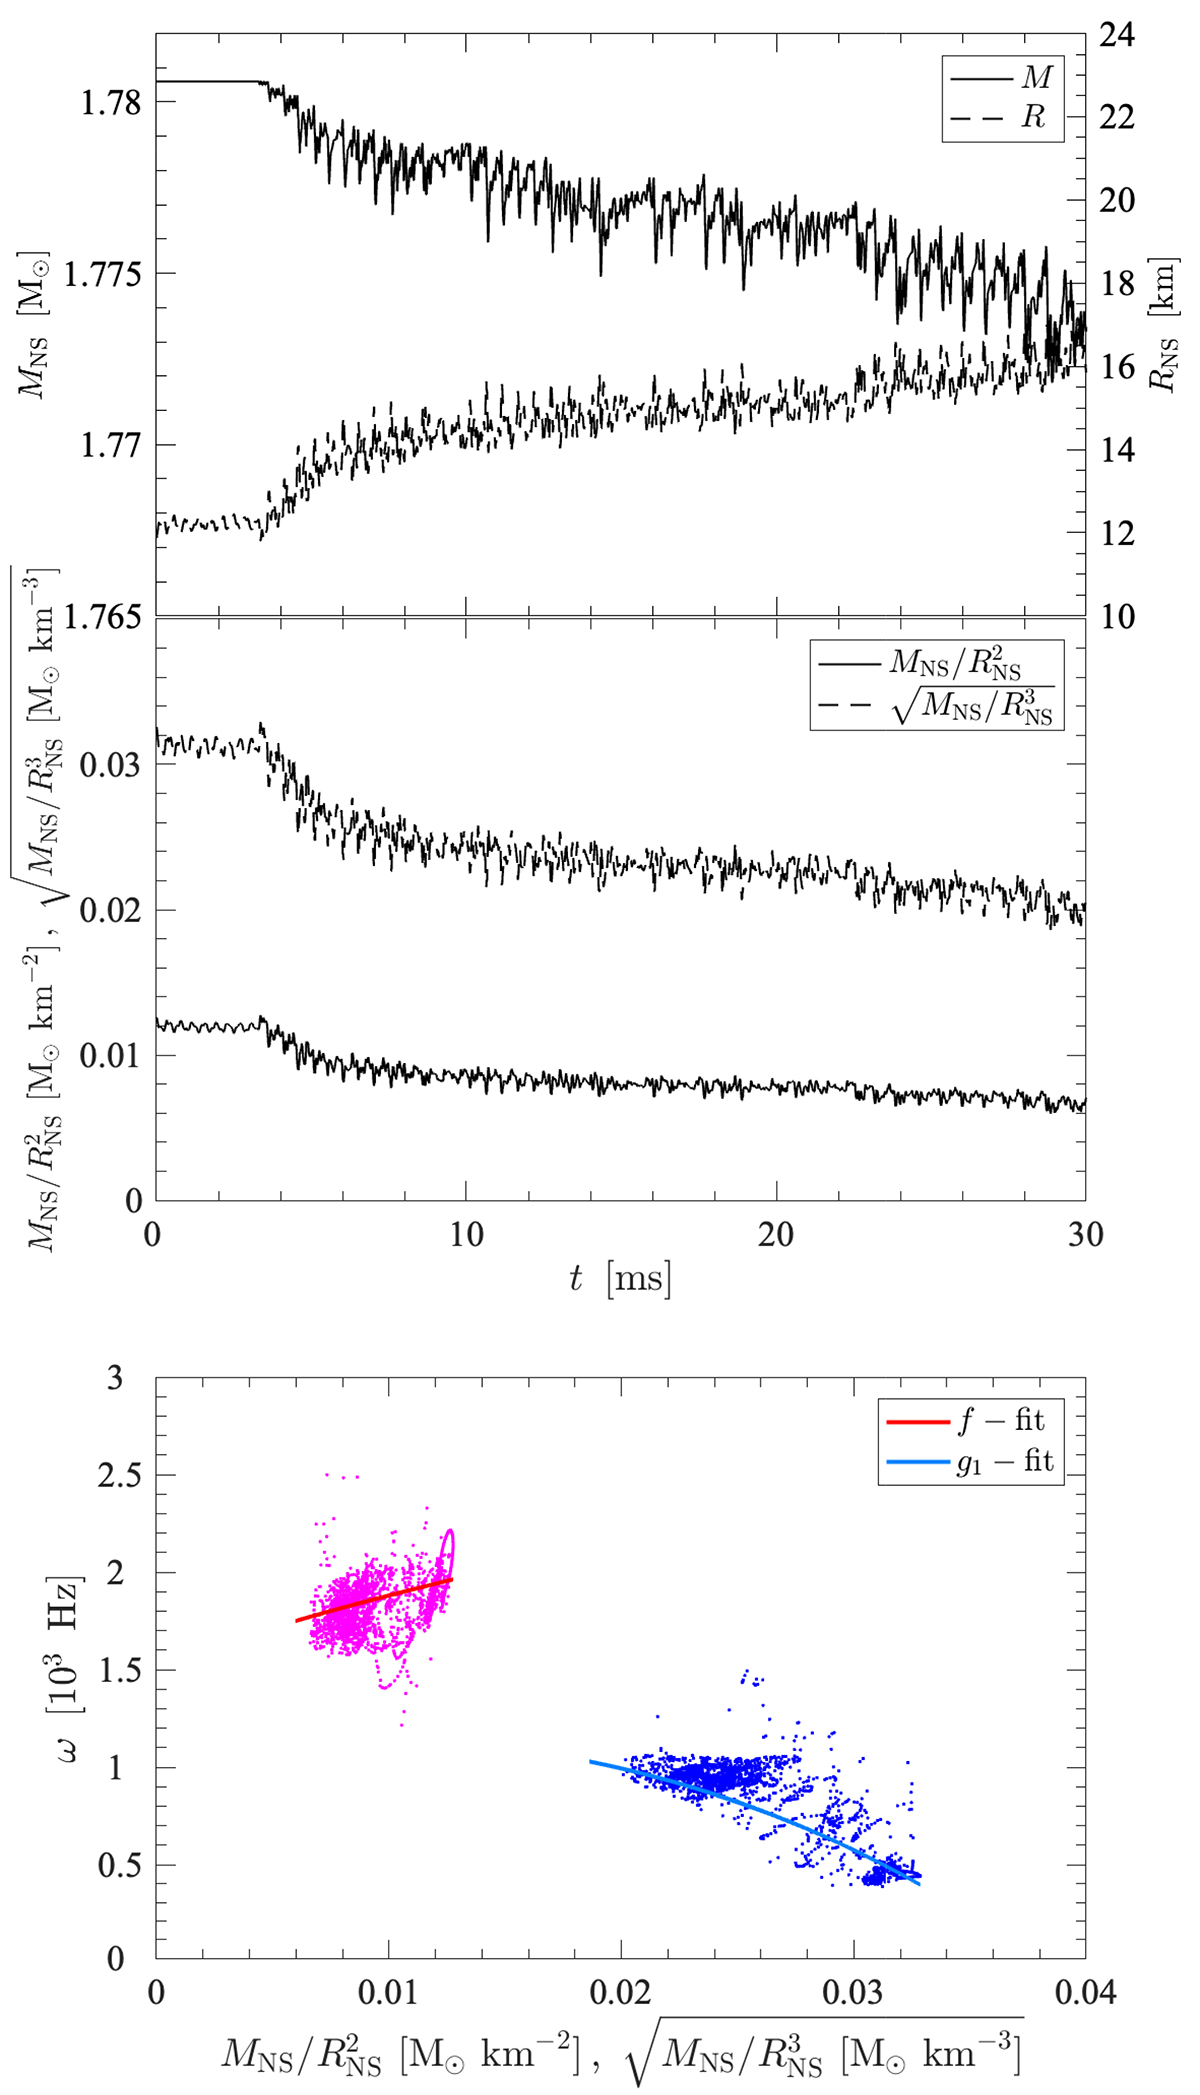
Fig. 8.
Download original image
Evolution of selected quantities and trends of the eigenmodes. Top panels: evolution of the NS enclosed mass MNS and radius RNS sampled at a rest-mass density of ρ = 1012 g cm−3. Bottom panel: dependencies of the f- and g1-mode frequencies (magenta and blue dots) with respect to the mean density and surface gravity, respectively, along with the corresponding f- and g1-mode fit expressions (2).
Current usage metrics show cumulative count of Article Views (full-text article views including HTML views, PDF and ePub downloads, according to the available data) and Abstracts Views on Vision4Press platform.
Data correspond to usage on the plateform after 2015. The current usage metrics is available 48-96 hours after online publication and is updated daily on week days.
Initial download of the metrics may take a while.