Fig. 7.
Download original image
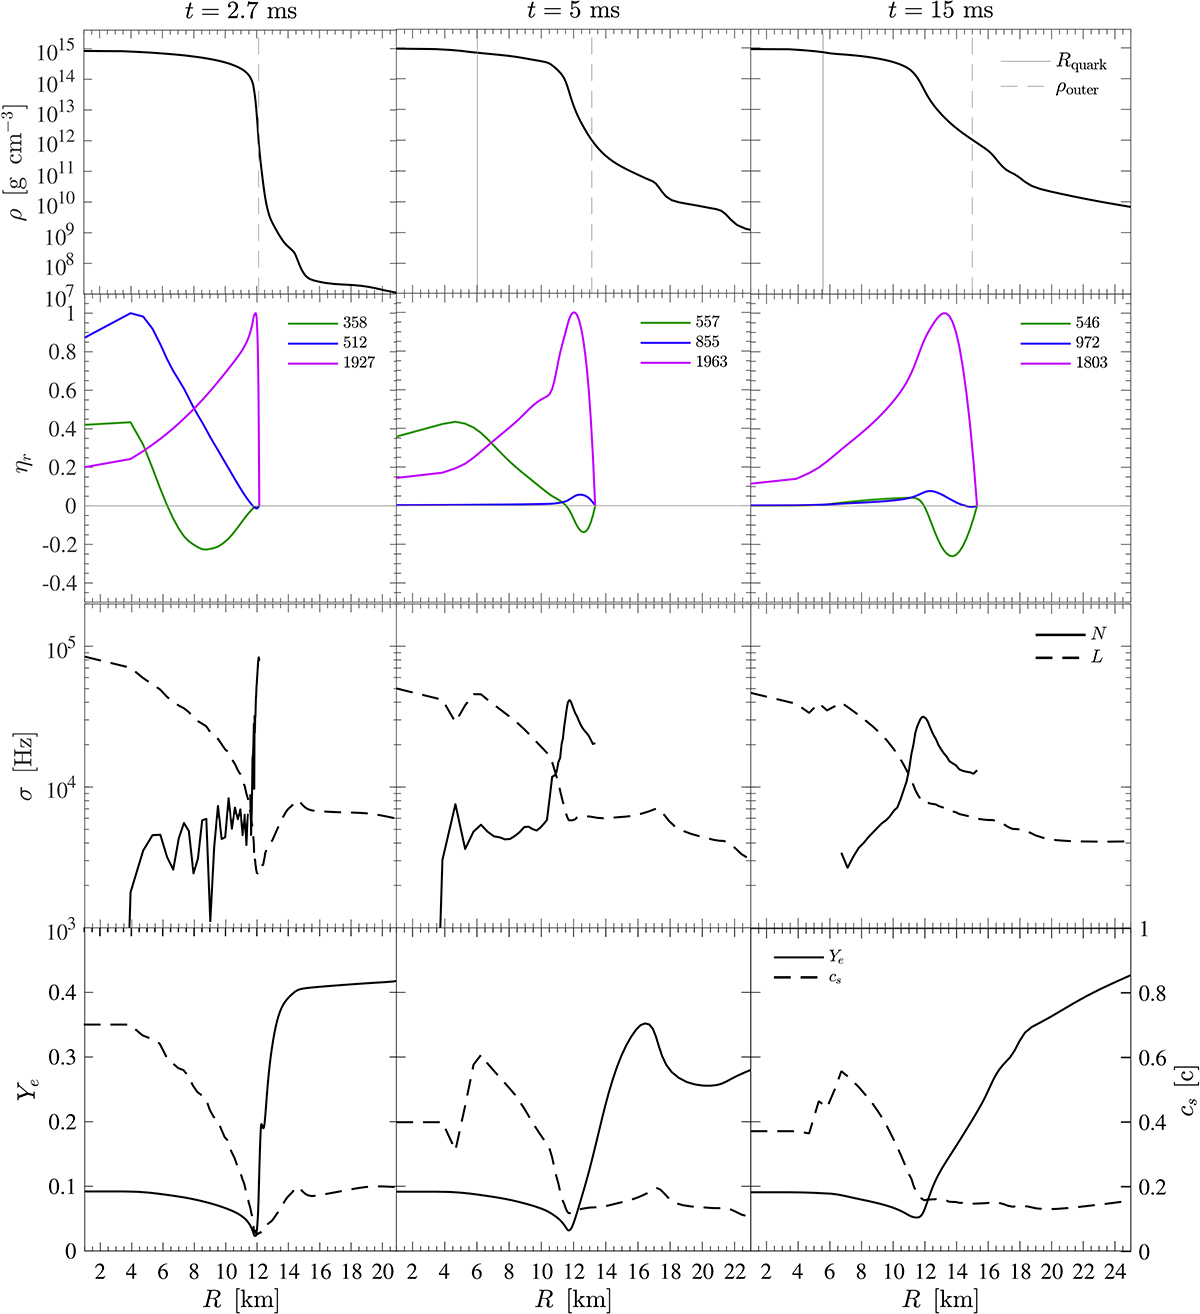
Radial profiles of selected quantities. From top to bottom, the figure shows the rest-mass density ρ; the radial solutions of the eigenfrequencies ηr for the highest three modes found, indicating the corresponding frequencies (values in the legends are in units of hertz and use the same colors as those in Fig. 6); the Lamb L and Brunt–Väisälä N frequencies as well as the Ye; and the speed of sound cs at three different times (see Fig. 6), corresponding to the hadronic evolution at 2.7 ms, the transition when quark matter appears at 5 ms, and at late times which is around 15 ms of simulation time. The vertical lines in the density plots (top panels) mark the locations of the outer boundary condition ρouter (dashed line) and the location for the onset of the quark matter core Rquark (solid line).
Current usage metrics show cumulative count of Article Views (full-text article views including HTML views, PDF and ePub downloads, according to the available data) and Abstracts Views on Vision4Press platform.
Data correspond to usage on the plateform after 2015. The current usage metrics is available 48-96 hours after online publication and is updated daily on week days.
Initial download of the metrics may take a while.