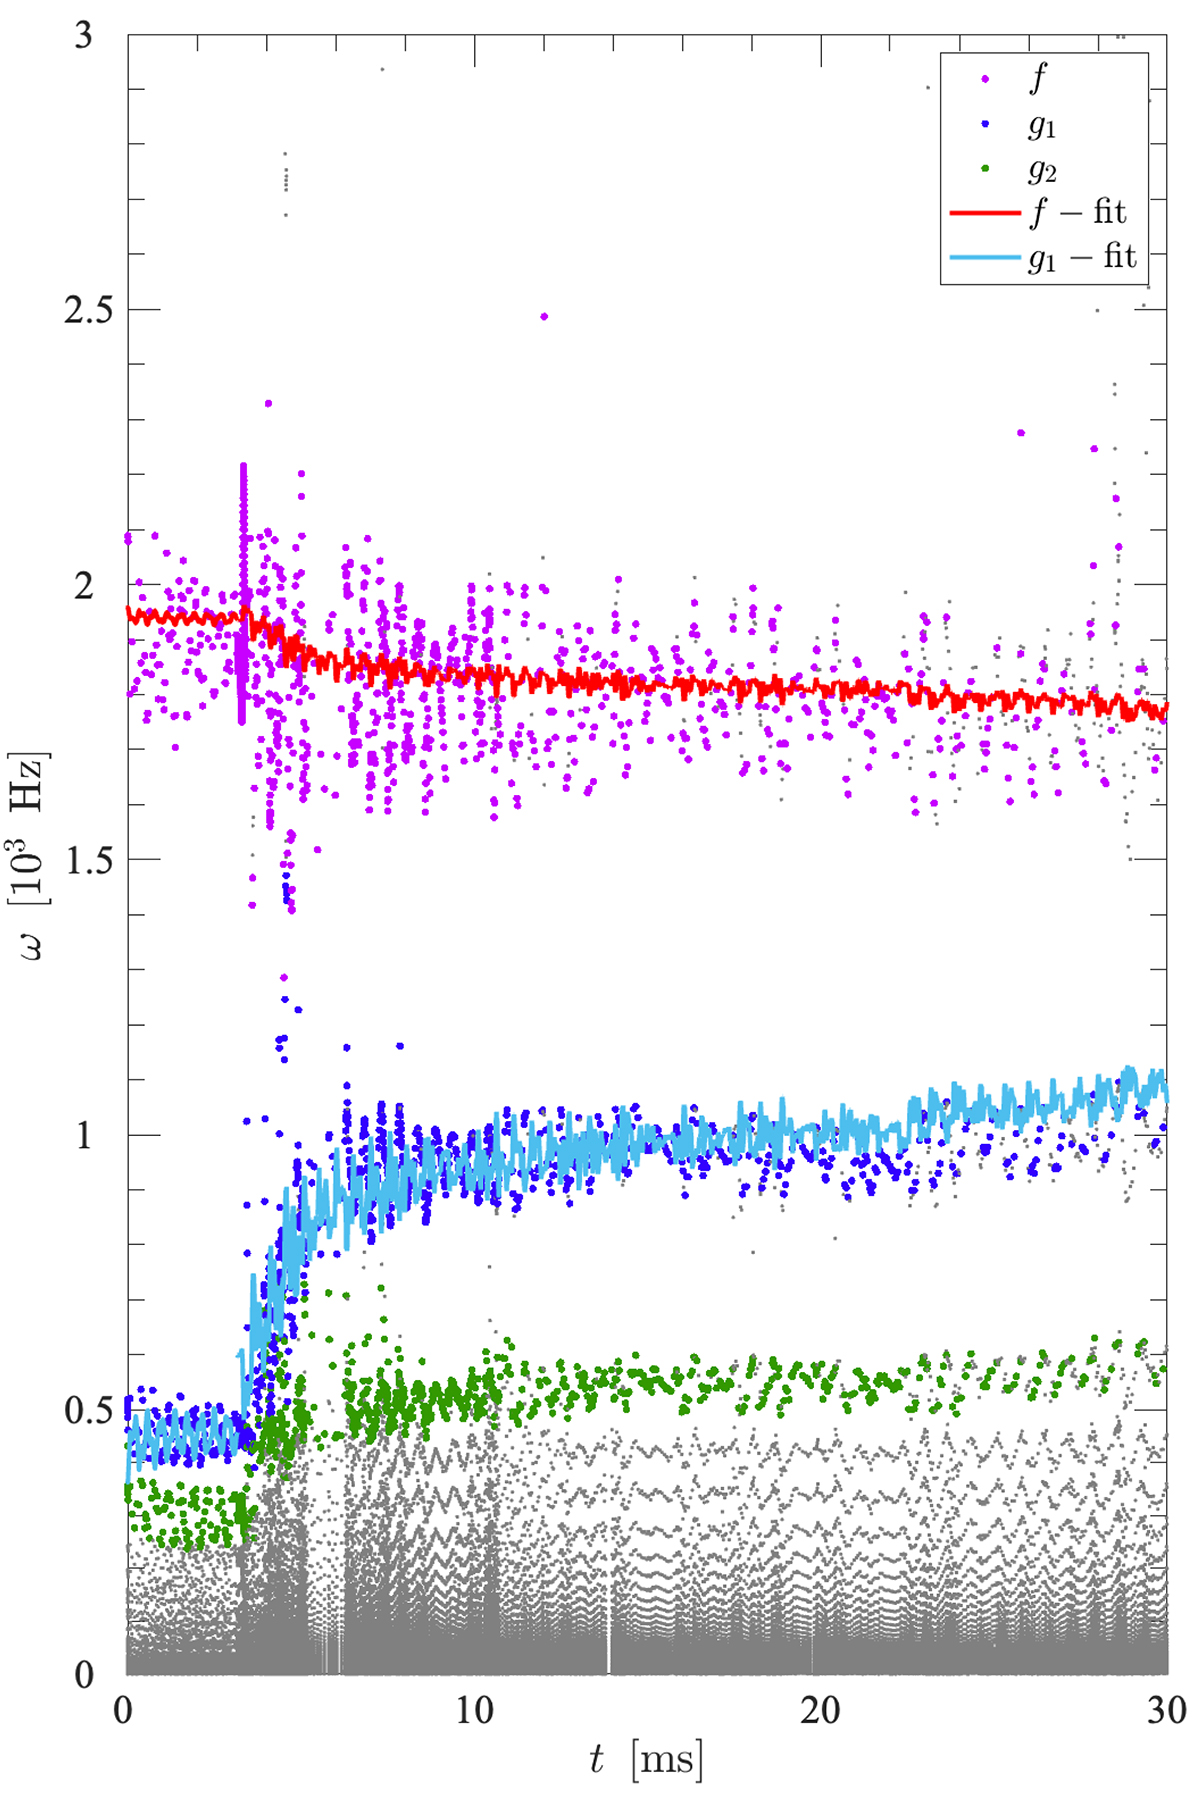
Fig. 6.
Download original image
Results of the mode analysis showing the solutions of the GREAT analysis (gray dots). Highlighted in the figure are the f (magenta dots), g1 (dark blue dots), and g2 modes (green dots) as well as the fit expressions (2) for the f (solid red line) and g1 modes (light blue lines). The results were obtained with an outer boundary located at ρouter = 1012 g cm−3, that is, excluding possible contributions from low-density solutions that might give rise to p modes (see text for details).
Current usage metrics show cumulative count of Article Views (full-text article views including HTML views, PDF and ePub downloads, according to the available data) and Abstracts Views on Vision4Press platform.
Data correspond to usage on the plateform after 2015. The current usage metrics is available 48-96 hours after online publication and is updated daily on week days.
Initial download of the metrics may take a while.