Open Access
Fig. 8
Download original image
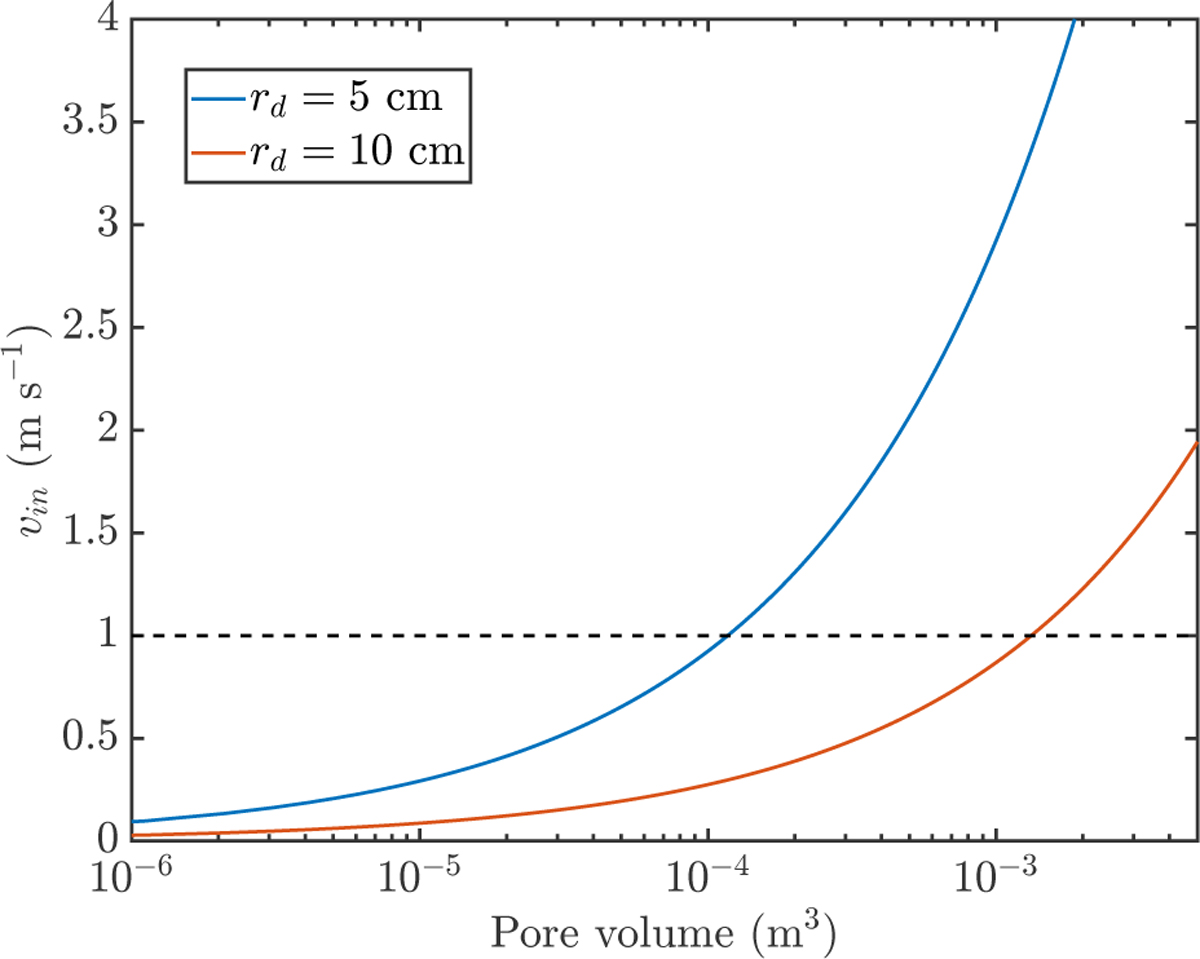
Initial velocity of aggregates as a function of the volume of the pore containing the gas, as determined by Eq. (12). The blue line corresponds to 5 cm radius aggregates, and the red line 10 cm radius aggregates. The horizontal dashed line indicates an initial velocity of 1 ms−1.
Current usage metrics show cumulative count of Article Views (full-text article views including HTML views, PDF and ePub downloads, according to the available data) and Abstracts Views on Vision4Press platform.
Data correspond to usage on the plateform after 2015. The current usage metrics is available 48-96 hours after online publication and is updated daily on week days.
Initial download of the metrics may take a while.