Fig. 5
Download original image
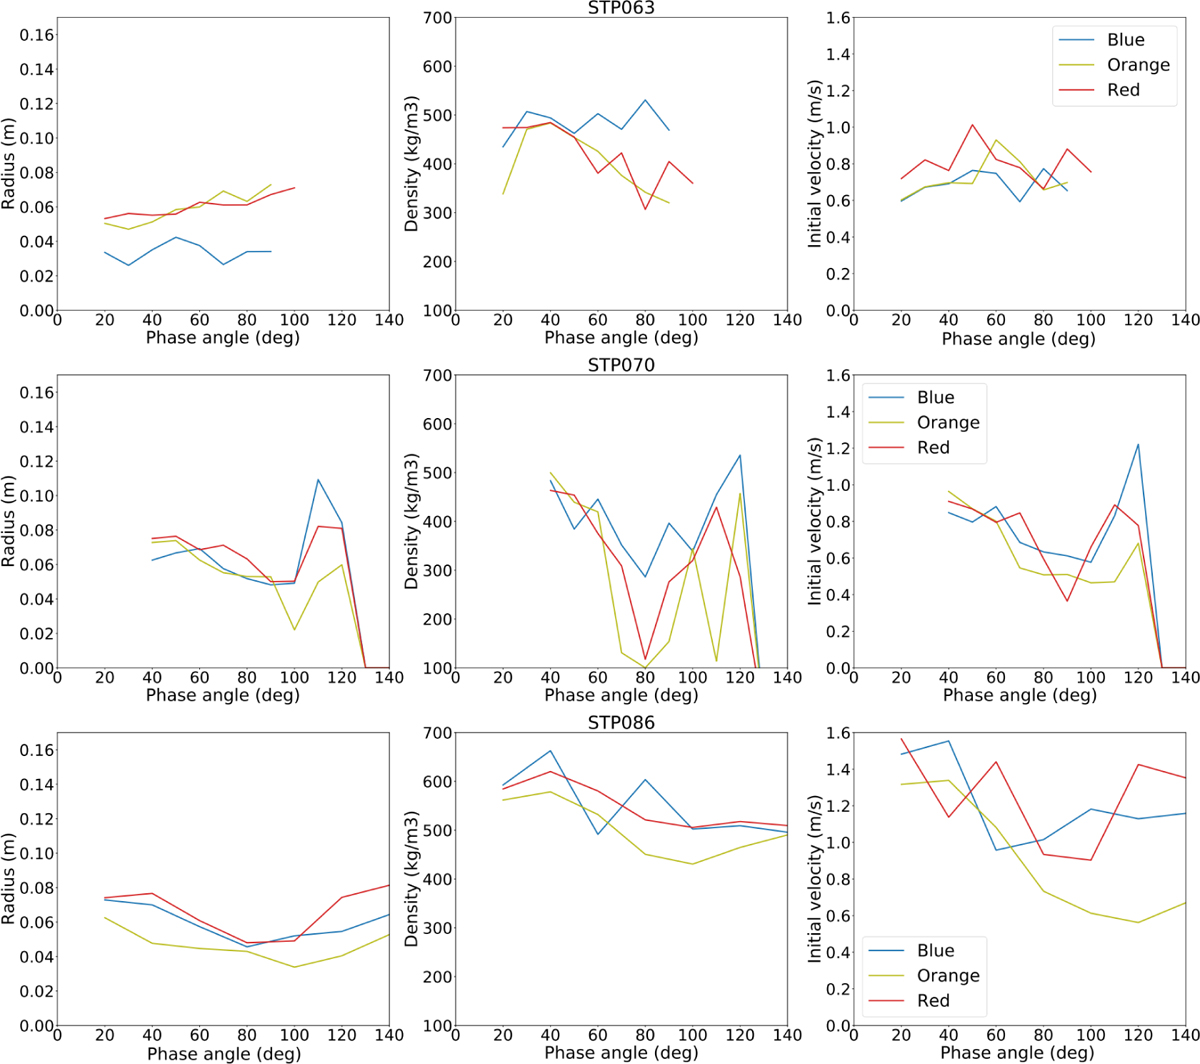
Mean aggregate parameters for sets STP063 (top), STP070 (middle), and STP086 (bottom) as a function of phase angle. Each row represents a different image set, while the columns from left to right represent the aggregate radius (rd), density (ρd), and initial velocity (υin). The colors show the results for images taken with filters Blue F24, Orange F22, and Red F28.
Current usage metrics show cumulative count of Article Views (full-text article views including HTML views, PDF and ePub downloads, according to the available data) and Abstracts Views on Vision4Press platform.
Data correspond to usage on the plateform after 2015. The current usage metrics is available 48-96 hours after online publication and is updated daily on week days.
Initial download of the metrics may take a while.