Open Access
Fig. 3
Download original image
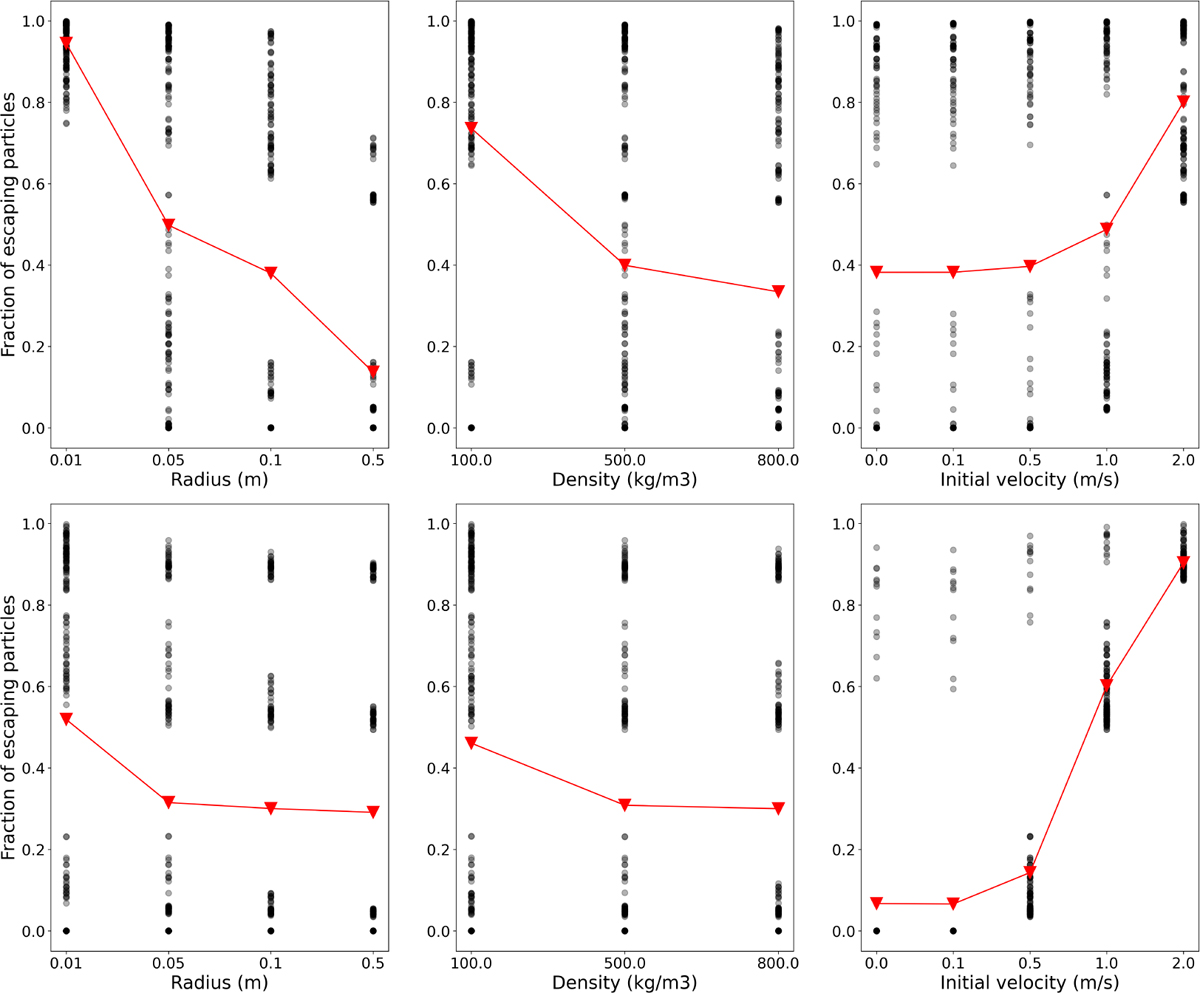
Fraction of aggregates escaping the integration domain for image sets STP070 (top) and STP096 (bottom). Each black dot represents the mean of all particles in a single simulation, whereas the red symbols denote the mean across all aggregates of that particular kind, considering the cumulative data from all simulations.
Current usage metrics show cumulative count of Article Views (full-text article views including HTML views, PDF and ePub downloads, according to the available data) and Abstracts Views on Vision4Press platform.
Data correspond to usage on the plateform after 2015. The current usage metrics is available 48-96 hours after online publication and is updated daily on week days.
Initial download of the metrics may take a while.