Fig. 11
Download original image
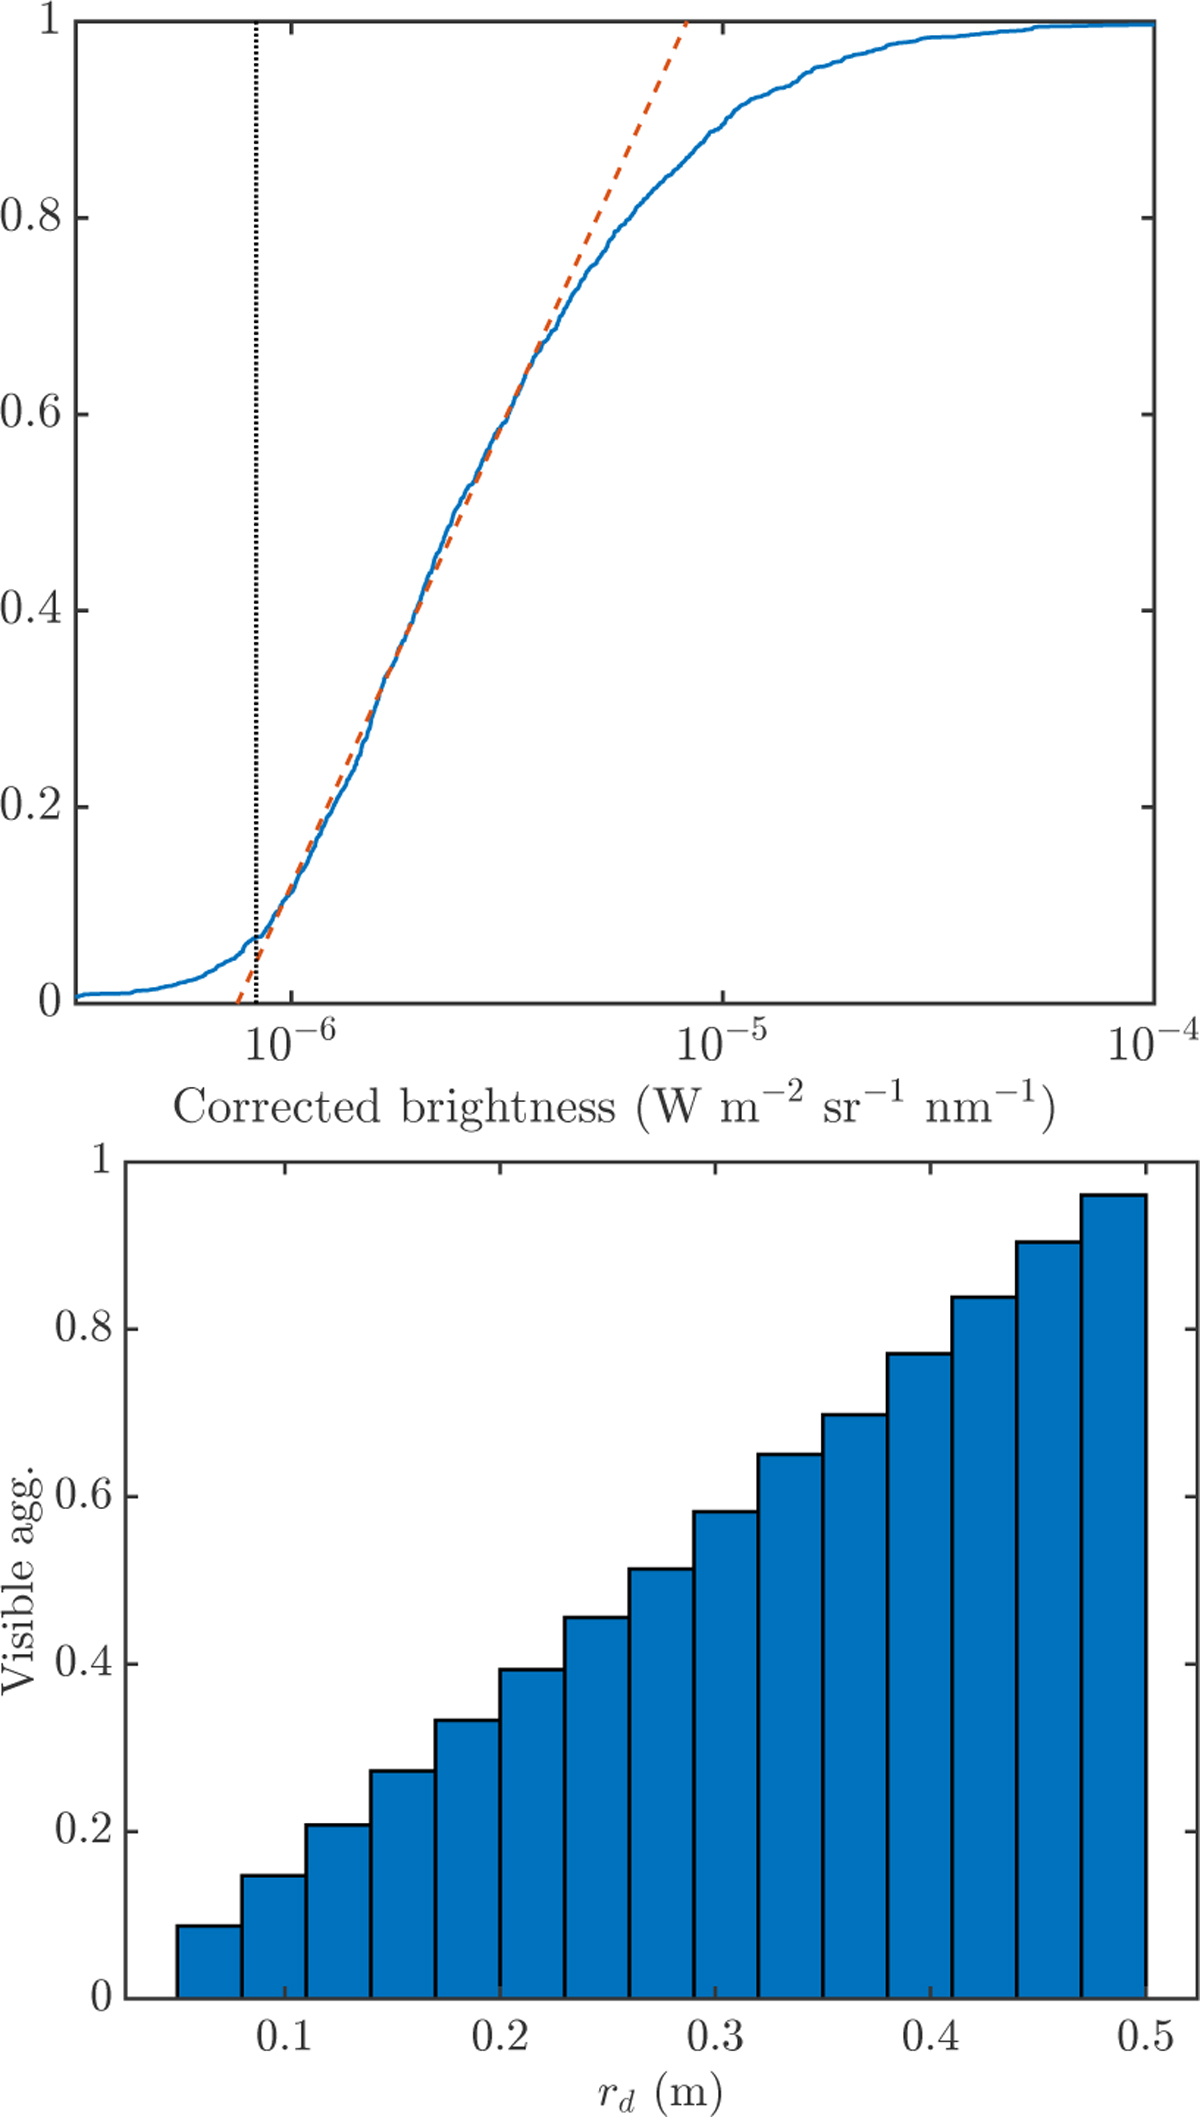
Estimation of limit brightness and visible aggregates. Top: cumulative distribution of phase-function-corrected track brightness for images obtained for set STP096 using the Red filter. The dashed line indicates the best fit for the linear part, while the dotted black line shows the minimum brightness for which the sample is complete. Bottom: fraction of aggregates with brightness higher than Blim at a distance ≤ζmax from the spacecraft, assuming a stationary coma model.
Current usage metrics show cumulative count of Article Views (full-text article views including HTML views, PDF and ePub downloads, according to the available data) and Abstracts Views on Vision4Press platform.
Data correspond to usage on the plateform after 2015. The current usage metrics is available 48-96 hours after online publication and is updated daily on week days.
Initial download of the metrics may take a while.