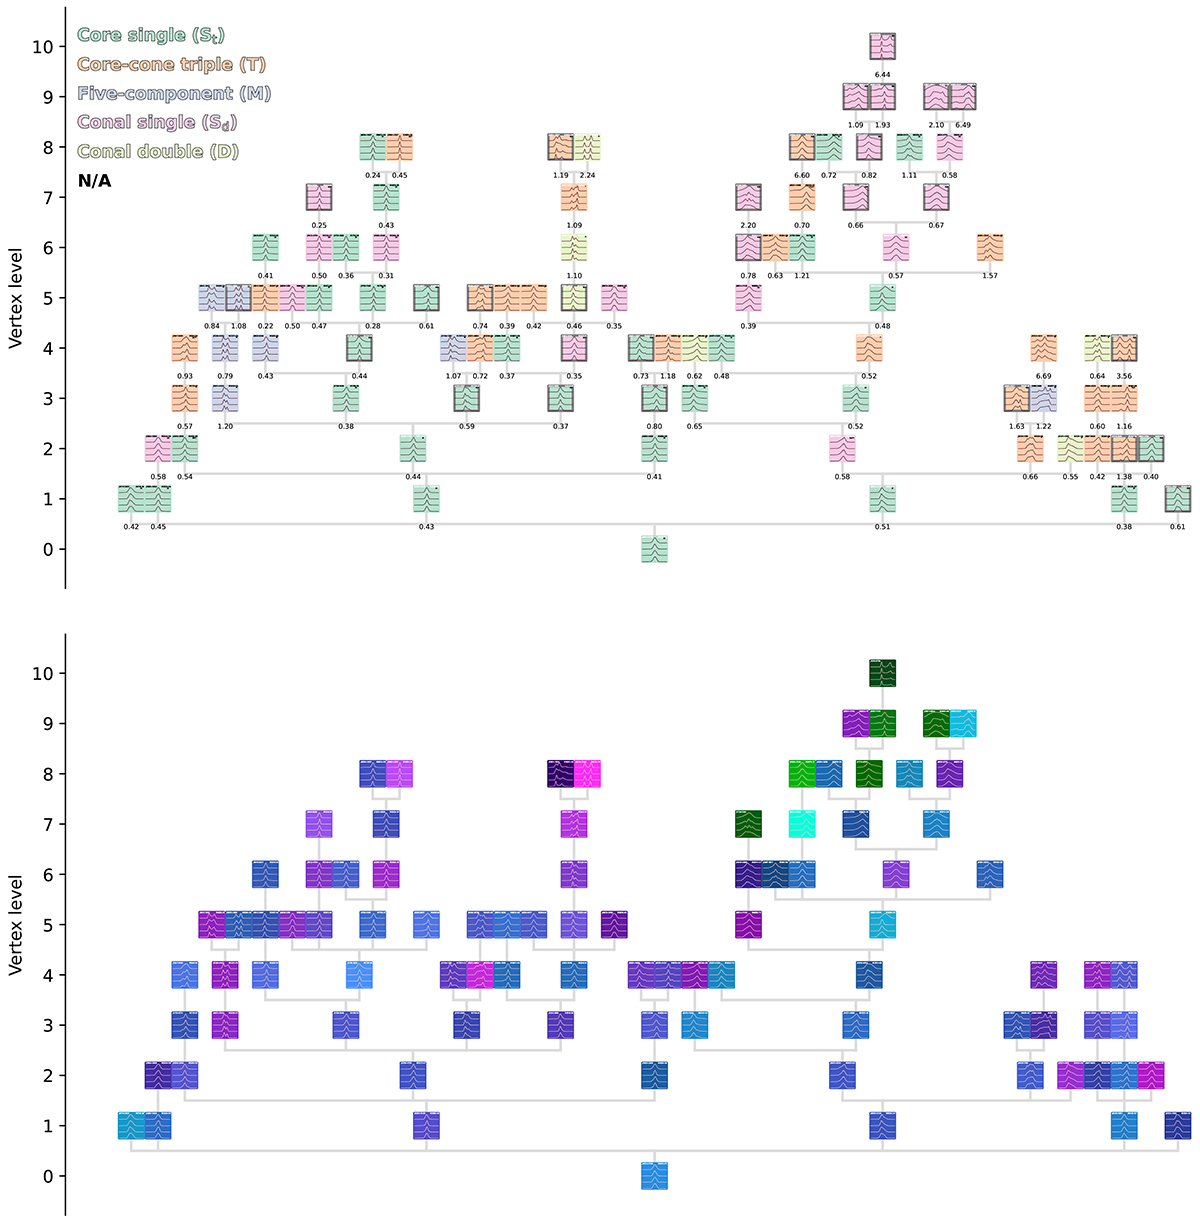
Fig. 5.
Download original image
Same MST as in Fig. 4. Upper panel: Rankin classification scheme. (See Sect. 4 for details.) Grey borders correspond to pulsars without a clear prior classification in the reference papers; classified here using the method described in Sect. 4. To simplify classification interpretation, instead of using a colour bar to display DTW distance between neighbouring vertices, we display w directly below each branch. Lower panel: Relation between pulsar positions in the tree and in P−Ṗ space. The box colour results from mapping P, Ė, and B (Fig. 1) to the red, green, and blue (RGB) channels, respectively.
Current usage metrics show cumulative count of Article Views (full-text article views including HTML views, PDF and ePub downloads, according to the available data) and Abstracts Views on Vision4Press platform.
Data correspond to usage on the plateform after 2015. The current usage metrics is available 48-96 hours after online publication and is updated daily on week days.
Initial download of the metrics may take a while.