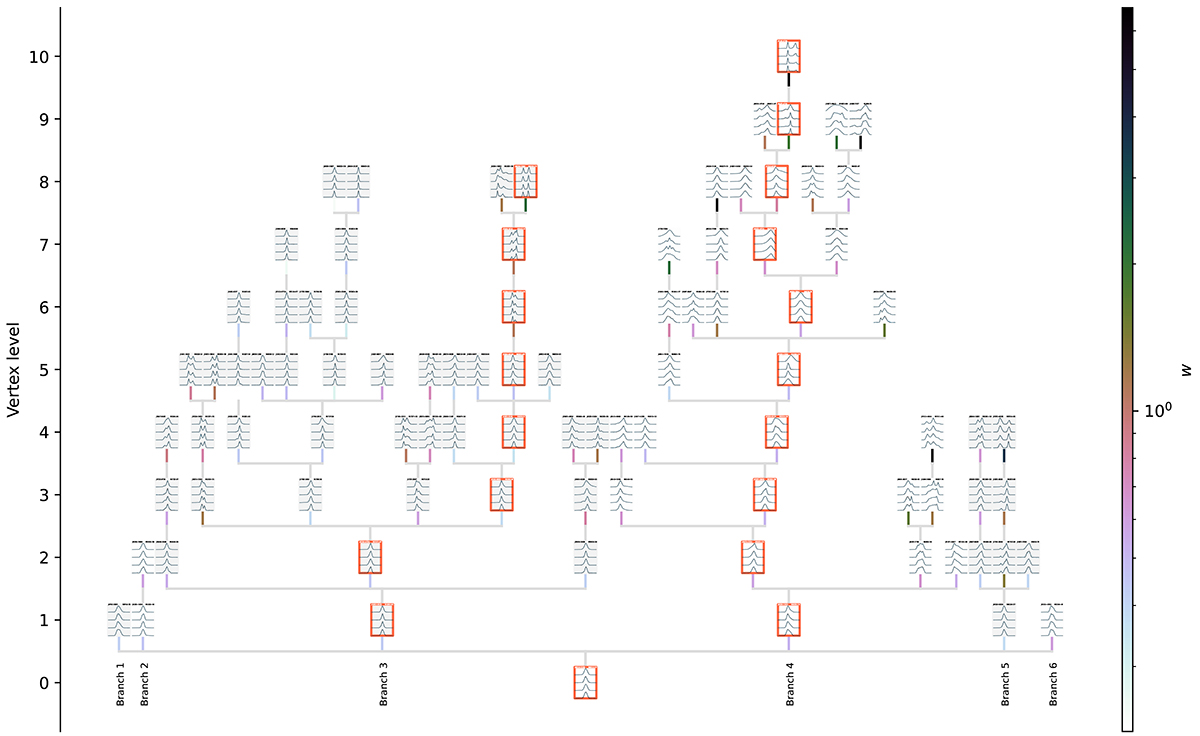
Fig. 4.
Download original image
Minimum spanning tree obtained using profiles by averaging distance at all four frequency bins. Each box shows the profiles of a given pulsar with the rotational phase showing the ten percent width (W10) plus an extra 0.05 on each side. The lowest frequency is at the top, and the highest is at the bottom of each panel. The root (most central vertex) can be seen at level 0, and a child is located at level L(parent) + 1. The weight w (distance obtained by computing the DTW) between a child and its parent is shown as the colour of the line below each child. Pulsars forming the longest sequence (Fig. 3) are highlighted with orange borders. The digital version of this figure can be zoomed and panned to inspect individual details. Pulsars can be searched by name, which combined with an appropriate zoom, can ease localisation of them in the MST.
Current usage metrics show cumulative count of Article Views (full-text article views including HTML views, PDF and ePub downloads, according to the available data) and Abstracts Views on Vision4Press platform.
Data correspond to usage on the plateform after 2015. The current usage metrics is available 48-96 hours after online publication and is updated daily on week days.
Initial download of the metrics may take a while.