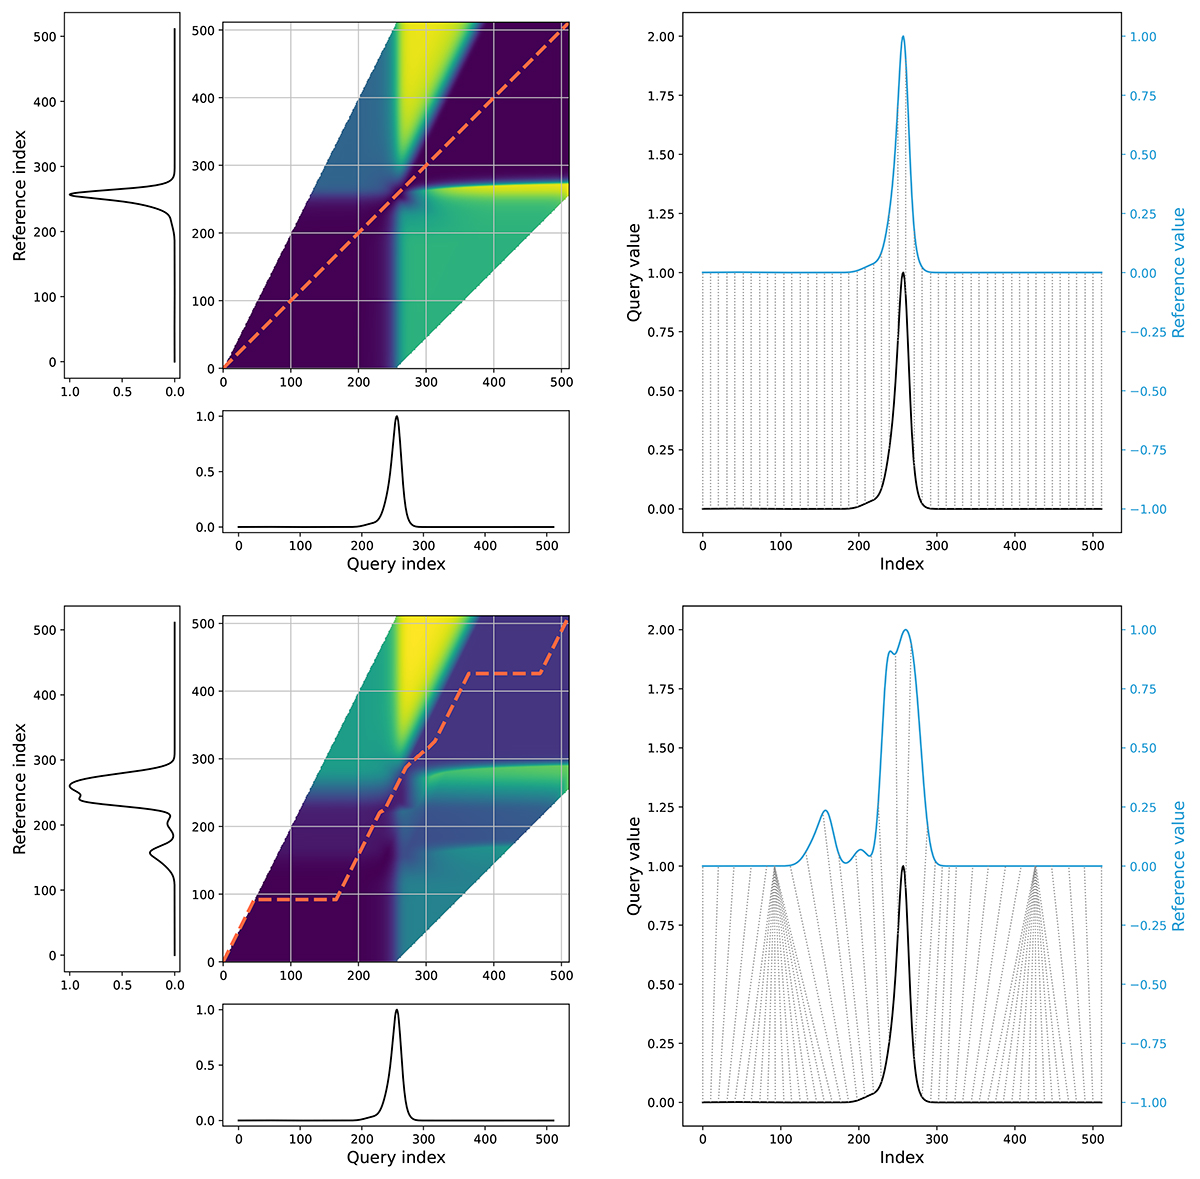
Fig. 2.
Download original image
Depiction of distance measurement by the dynamic time warp algorithm. In the left panels, pulse profiles are shown as query and reference profiles corresponding to the x and y axes of the local cost matrix where the ‘warping path’ is computed. In the right panels, the same two profiles now show a subset of warping tracks highlighting matched samples along the warping path. The top row shows a comparison of a profile from PSR B0950+08 (J0953+0755) with itself leading a path of least resistance (following the heat map ‘cost valley’) corresponding to a perfect diagonal in the local cost matrix. The bottom row shows a comparison of PSR B0950+08 (J0953+0755) as a query with J1803–2137 (B1800–21) as a reference. The path of least resistance steps off the perfect diagonal, leading to a higher distance measure. The heat map also highlights the band of size K = 256 used to constrain our search.
Current usage metrics show cumulative count of Article Views (full-text article views including HTML views, PDF and ePub downloads, according to the available data) and Abstracts Views on Vision4Press platform.
Data correspond to usage on the plateform after 2015. The current usage metrics is available 48-96 hours after online publication and is updated daily on week days.
Initial download of the metrics may take a while.