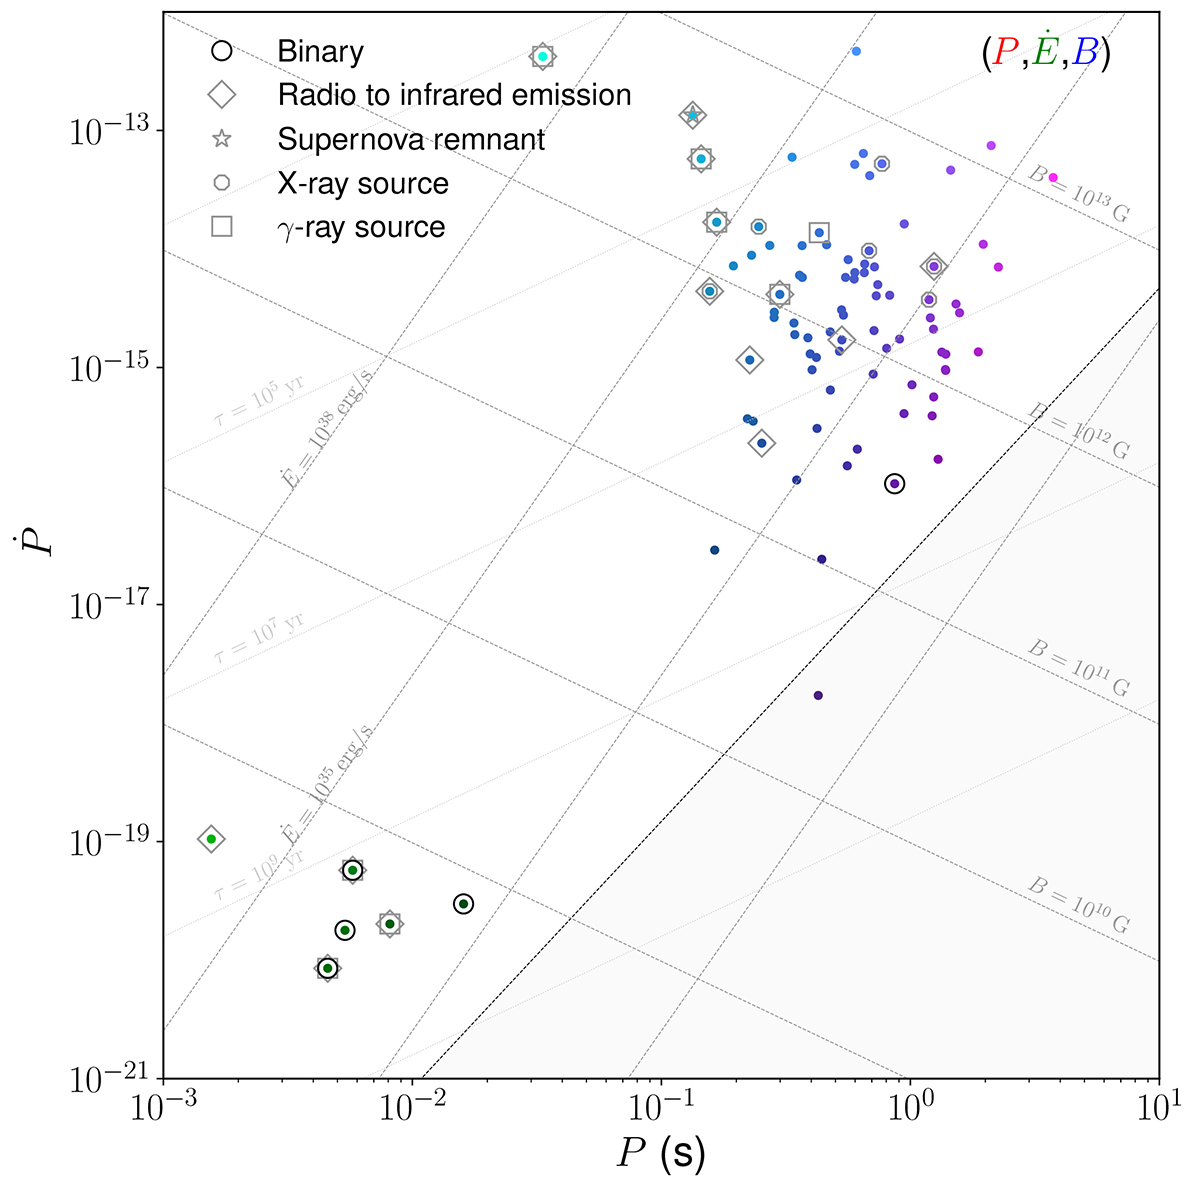
Fig. 1.
Download original image
P−Ṗ diagram for selected pulsars. Marker colours were defined by mapping the red, green, and blue (R, G, B) channels to the period, spin-down energy, and magnetic field strength (P, Ė, B), respectively, using inverse hyperbolic sine scaling. Additionally, we highlight pulsars in binary systems, spin-powered pulsars with pulsed emission from radio to infrared or higher frequencies, association to a supernova remnant, and x-ray and γ-ray sources.
Current usage metrics show cumulative count of Article Views (full-text article views including HTML views, PDF and ePub downloads, according to the available data) and Abstracts Views on Vision4Press platform.
Data correspond to usage on the plateform after 2015. The current usage metrics is available 48-96 hours after online publication and is updated daily on week days.
Initial download of the metrics may take a while.