Fig. 9.
Download original image
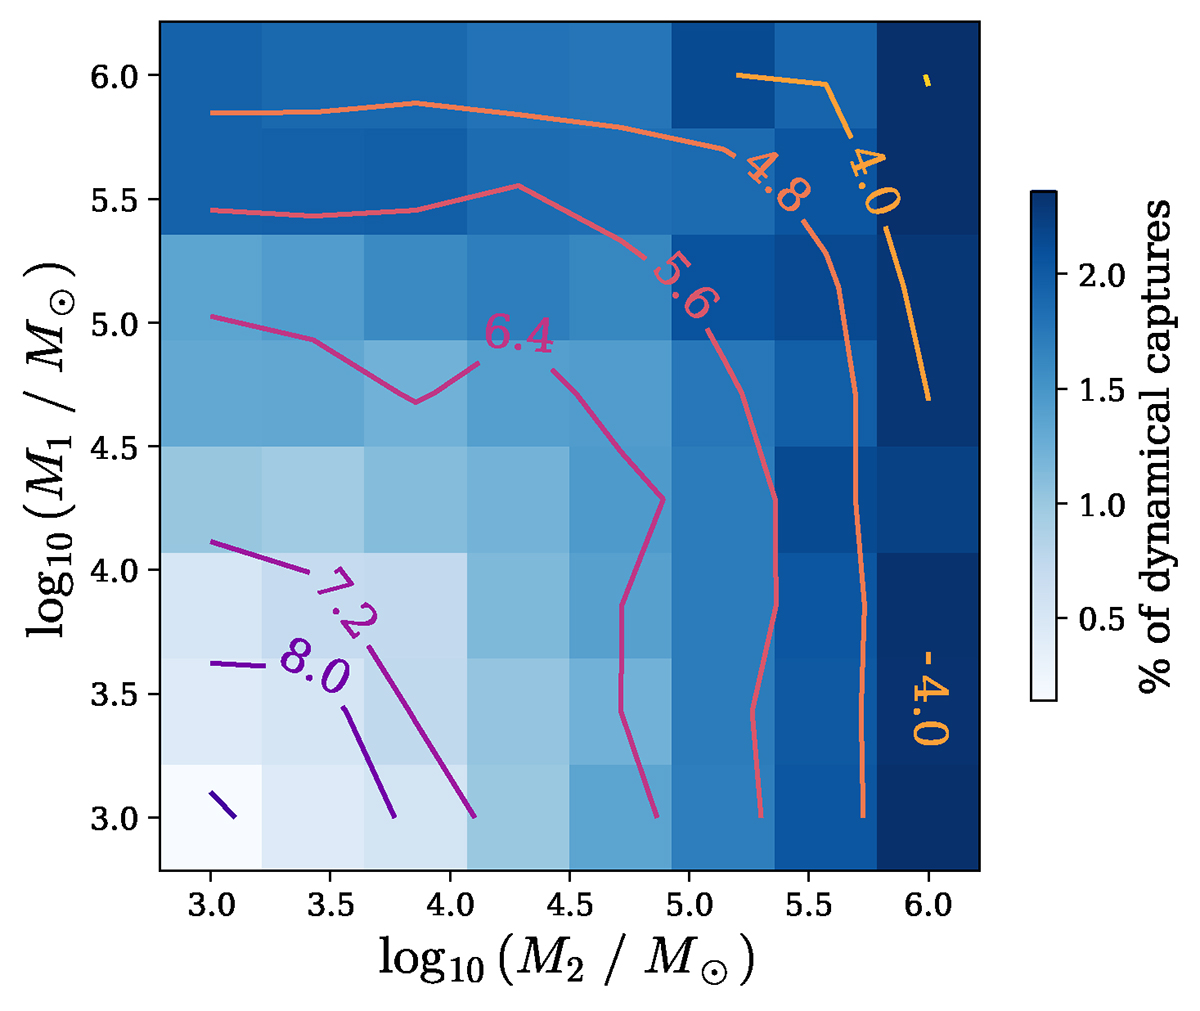
Percentage of dynamical captures as a function of inner (M1) and outer (M2) BH mass. The contour lines represent the average time it took for the capture to occur since the start of the simulation, measured in Gyr. The percentage of captures increases as the mass of the two BHs increases, and the mass of the outer BH is greater than the mass of the inner one (M2 > M1).
Current usage metrics show cumulative count of Article Views (full-text article views including HTML views, PDF and ePub downloads, according to the available data) and Abstracts Views on Vision4Press platform.
Data correspond to usage on the plateform after 2015. The current usage metrics is available 48-96 hours after online publication and is updated daily on week days.
Initial download of the metrics may take a while.