Fig. 7.
Download original image
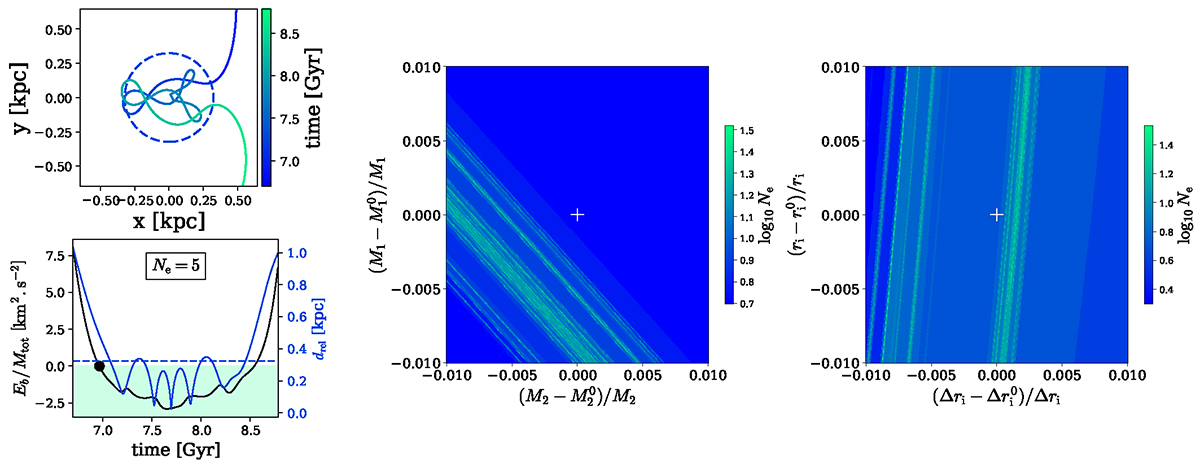
Influence of the initial conditions on the number of close encounters (Ne). Left panel: reference Jacobi capture (![]() ,
, ![]() ,
, ![]() ,
, ![]() ,
, ![]() , with significant figures up to the resolution of the central and right panels). The top row shows the relative coordinates between the BHs during the capture. The reference frame is centered on the most massive black hole and rotates with it. The binary Hill radius is indicated by the dotted circle. In the bottom row, the black line represents the binding energy (Eb) per unit mass of the binary (Mtot = M1 + M2), with negative values depicted in the colored area. The black marker indicates the point at which the energy becomes negative. The blue curve represents the relative distance (drel) between the BHs. The binary Hill radius is shown by a dashed blue line. The reference capture involves 5 close encounters between the black holes. Central panel: Ne variations as a function of initial conditions (M1, M2). The (M1, M2) values are distributed plus or minus 1% around the initial condition of the reference capture, denoted as (
, with significant figures up to the resolution of the central and right panels). The top row shows the relative coordinates between the BHs during the capture. The reference frame is centered on the most massive black hole and rotates with it. The binary Hill radius is indicated by the dotted circle. In the bottom row, the black line represents the binding energy (Eb) per unit mass of the binary (Mtot = M1 + M2), with negative values depicted in the colored area. The black marker indicates the point at which the energy becomes negative. The blue curve represents the relative distance (drel) between the BHs. The binary Hill radius is shown by a dashed blue line. The reference capture involves 5 close encounters between the black holes. Central panel: Ne variations as a function of initial conditions (M1, M2). The (M1, M2) values are distributed plus or minus 1% around the initial condition of the reference capture, denoted as (![]() ). Right panel: Ne variations as a function of initial conditions (ri, Δri). The (ri, Δri) values are distributed plus or minus 1% around the initial condition of the reference capture, denoted as (
). Right panel: Ne variations as a function of initial conditions (ri, Δri). The (ri, Δri) values are distributed plus or minus 1% around the initial condition of the reference capture, denoted as (![]() ). The reference capture is located at (0, 0) in each panel. The strong variations of Ne with initial conditions is suggestive of chaotic motion.
). The reference capture is located at (0, 0) in each panel. The strong variations of Ne with initial conditions is suggestive of chaotic motion.
Current usage metrics show cumulative count of Article Views (full-text article views including HTML views, PDF and ePub downloads, according to the available data) and Abstracts Views on Vision4Press platform.
Data correspond to usage on the plateform after 2015. The current usage metrics is available 48-96 hours after online publication and is updated daily on week days.
Initial download of the metrics may take a while.