Fig. 6.
Download original image
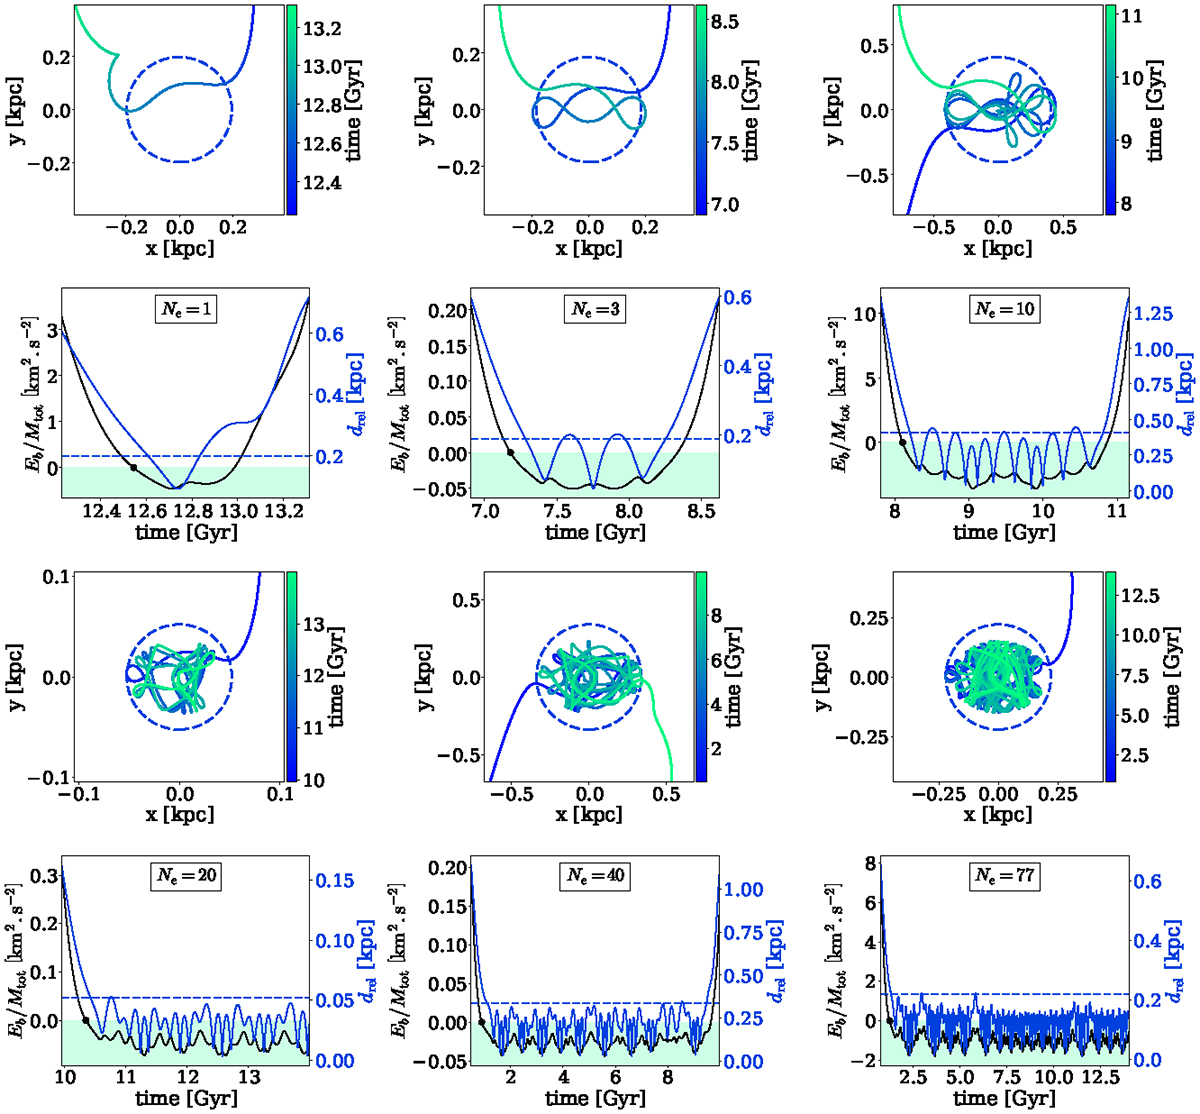
Examples of Jacobi captures with different numbers of close encounters between BHs. Top row: relative coordinates between BHs during Jacobi captures. The reference frame is centered on the most massive BH and rotates with it. The binary Hill radius is marked by the dotted circle. Bottom row: the black line represents the binding energy (Eb) per unit mass of the binary (Mtot = M1 + M2), with negative values shown in the colored area. The black marker indicates the point when the energy becomes negative. The blue curve represents the relative distance (drel) between the BHs. The binary Hill radius is indicated by a dashed blue line. The number of close encounters, Ne, is given in the box. To contextualize captures within observational framework, we extend our simulations over a period of 14 Gyr. Consequently, we observe instances where captures are halted prematurely, as illustrated by cases with Ne = 20 and Ne = 77. Additionally, we retain flybys due to our energy-based criterion, which is more stringent compared to distance-based criteria. This ensures that surviving flybys comprise black holes with similar energy levels, potentially facilitating stabilization through dissipative forces.
Current usage metrics show cumulative count of Article Views (full-text article views including HTML views, PDF and ePub downloads, according to the available data) and Abstracts Views on Vision4Press platform.
Data correspond to usage on the plateform after 2015. The current usage metrics is available 48-96 hours after online publication and is updated daily on week days.
Initial download of the metrics may take a while.