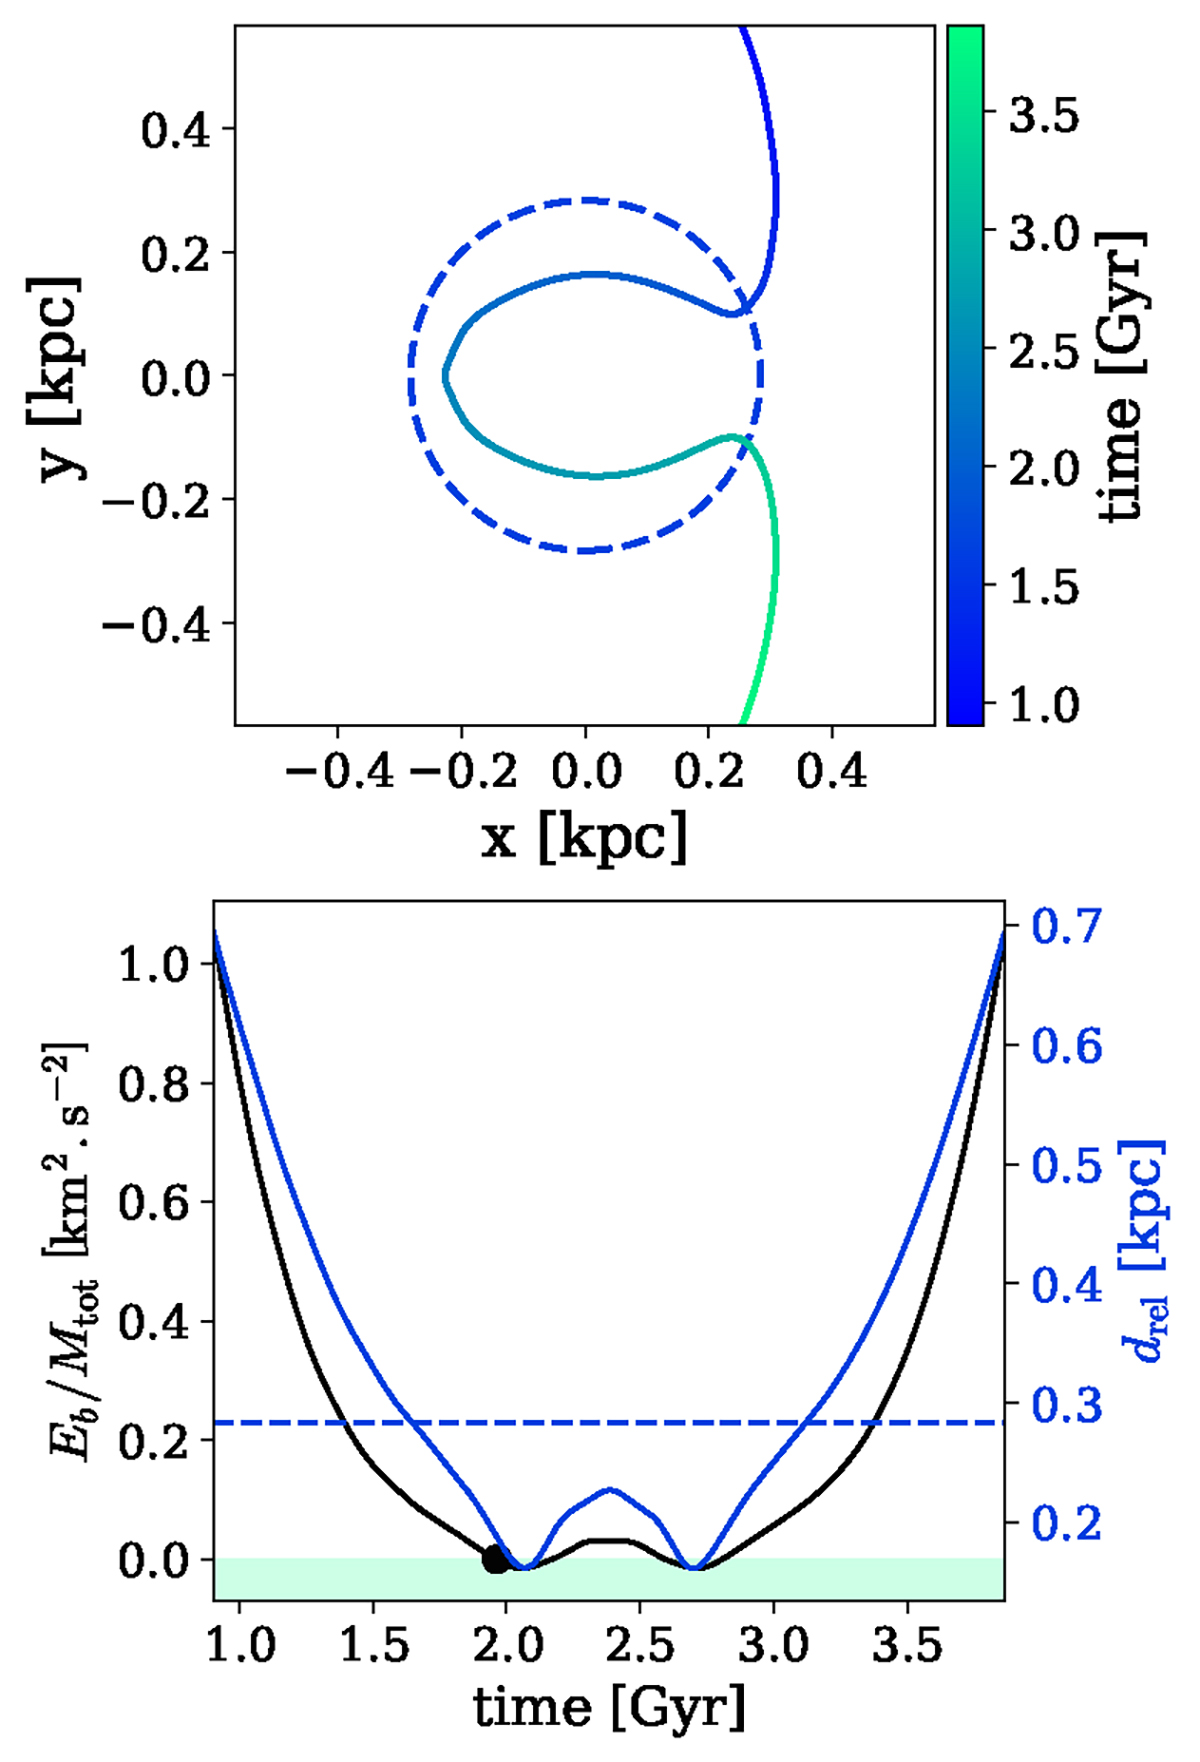
Fig. C.1.
Download original image
Example of Pacman orbit. Top row: relative coordinates between BHs during the Jacobi capture. The reference frame is centered on the most massive BH and rotates with it. The binary Hill radius is marked by the dotted circle. Bottom row: the black line represents the binding energy (Eb) per unit mass of the binary (Mtot = M1 + M2), with negative values shown in the colored area. The black marker indicates the point when the energy becomes negative. The blue curve represents the relative distance (drel) between the BHs. The binary Hill radius is indicated by a dashed blue line.
Current usage metrics show cumulative count of Article Views (full-text article views including HTML views, PDF and ePub downloads, according to the available data) and Abstracts Views on Vision4Press platform.
Data correspond to usage on the plateform after 2015. The current usage metrics is available 48-96 hours after online publication and is updated daily on week days.
Initial download of the metrics may take a while.