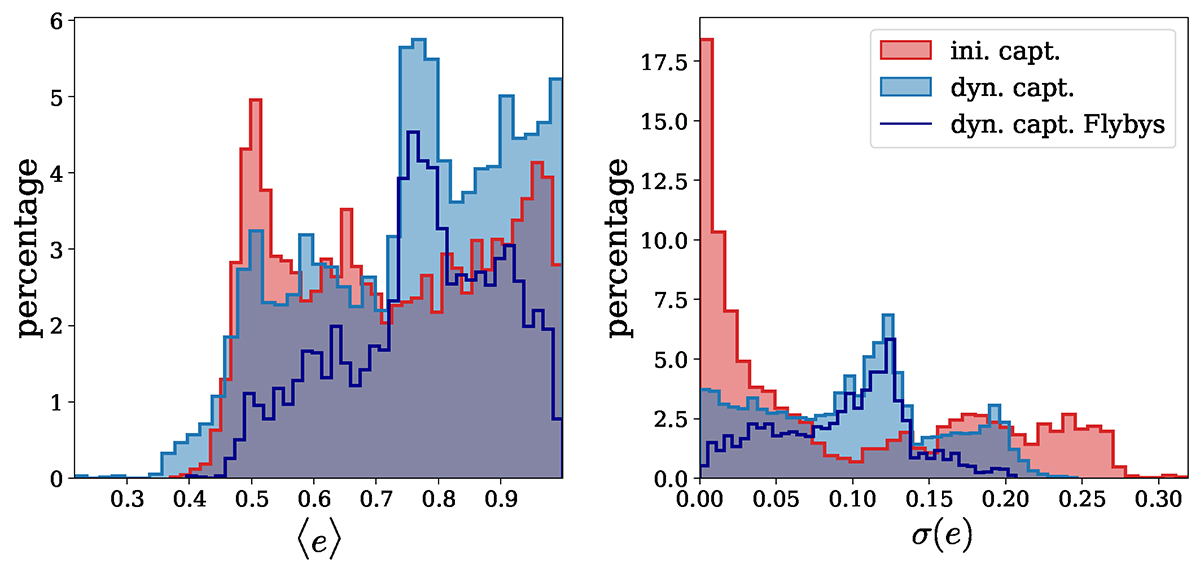
Fig. A.1.
Download original image
Eccentricity during Jacobi captures. Left panel: histogram in percent of the mean eccentricity of the binary during captures (initial captures in red and dynamical captures in blue). The dark blue line represents only dynamical captures with a single close encounter (i.e., flybys). Jacobi captures produce rather eccentric binaries. A significant proportion are in the very high eccentricity range (e ≳ 0.9), for which Post-Newtonian corrections can be significant at the pericenter. Right panel: percentage histogram of standard deviation of eccentricity during captures. These variations may permit a very high eccentricity during the capture, despite the lower mean eccentricity.
Current usage metrics show cumulative count of Article Views (full-text article views including HTML views, PDF and ePub downloads, according to the available data) and Abstracts Views on Vision4Press platform.
Data correspond to usage on the plateform after 2015. The current usage metrics is available 48-96 hours after online publication and is updated daily on week days.
Initial download of the metrics may take a while.