Fig. 11.
Download original image
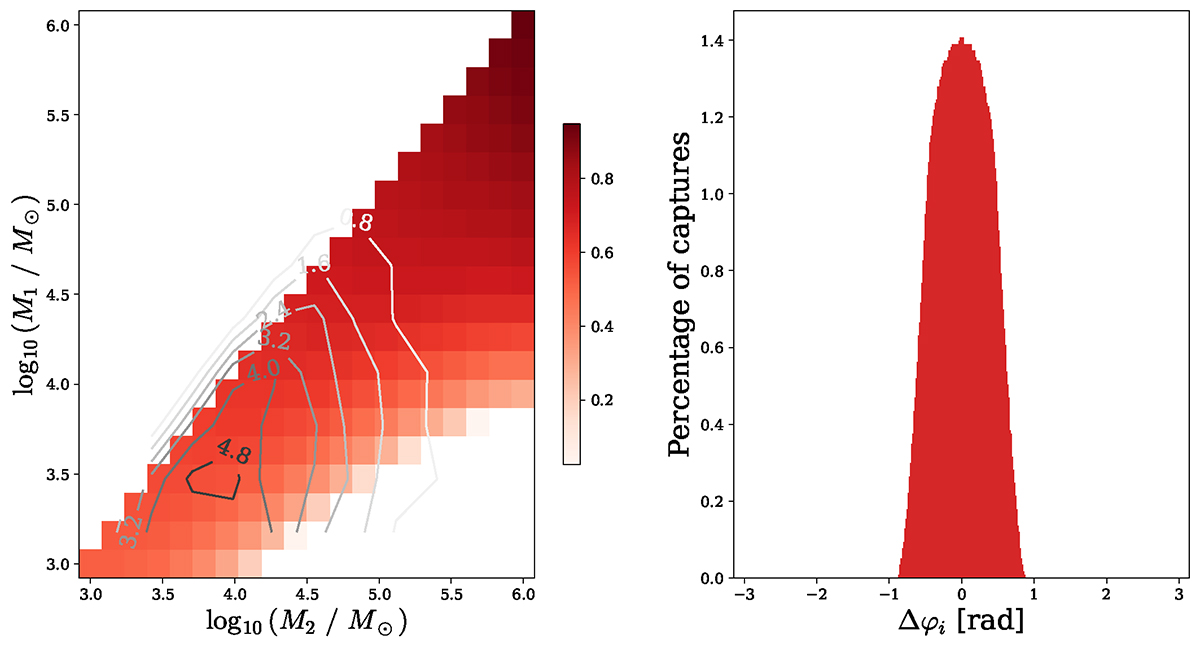
Percentage of captures in the three-parameter case. Left panel: as a function of inner (M1) and outer (M2) BH mass when positioned on their core stalling radius. The contour lines depict the probability (in percentage) of obtaining a mass pair (derived from a Monte Carlo sampling using SatGen, see Sect. 3.2.2). Right panel: as a function of the initial phase difference.
Current usage metrics show cumulative count of Article Views (full-text article views including HTML views, PDF and ePub downloads, according to the available data) and Abstracts Views on Vision4Press platform.
Data correspond to usage on the plateform after 2015. The current usage metrics is available 48-96 hours after online publication and is updated daily on week days.
Initial download of the metrics may take a while.