Fig. 10.
Download original image
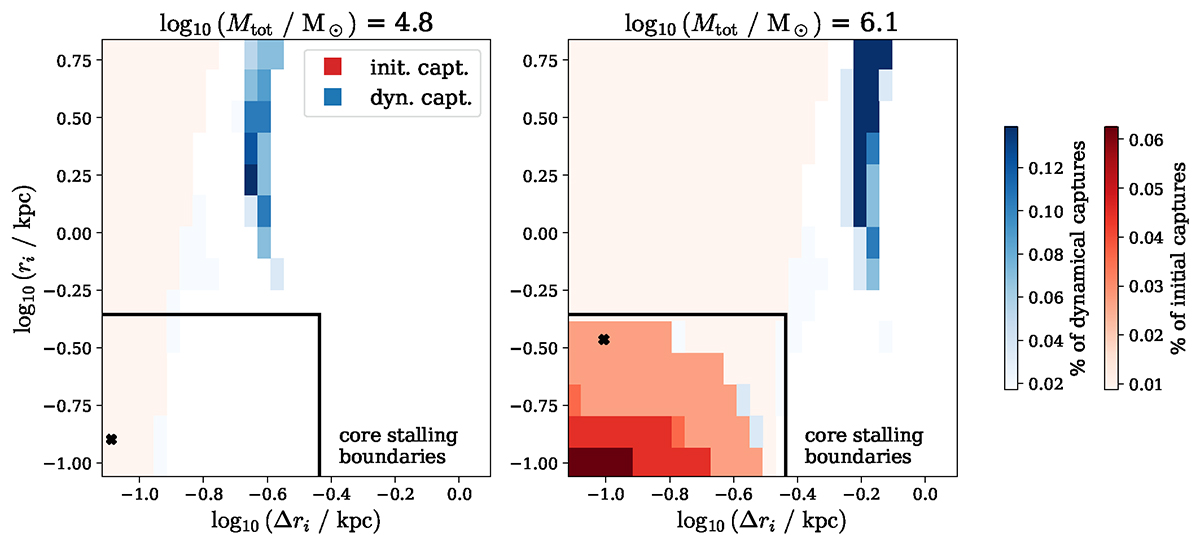
Percentage of captures as a function of initial inner BH radius (ri) and initial radial separation (Δri) for two mass pairs, On the left panel, log(M1/M⊙) = 3.9 and log(M2/M⊙) = 4.7, on the right panel, log(M1/M⊙) = 5.6 and log(M2/M⊙) = 6. Red areas represent initial captures while blue areas dynamical captures. The black lines indicate the limits within which core stalling can position our BHs, given the mass range studied. The black crosses indicate where core stalling would position the BHs in each case.
Current usage metrics show cumulative count of Article Views (full-text article views including HTML views, PDF and ePub downloads, according to the available data) and Abstracts Views on Vision4Press platform.
Data correspond to usage on the plateform after 2015. The current usage metrics is available 48-96 hours after online publication and is updated daily on week days.
Initial download of the metrics may take a while.