Fig. 7
Download original image
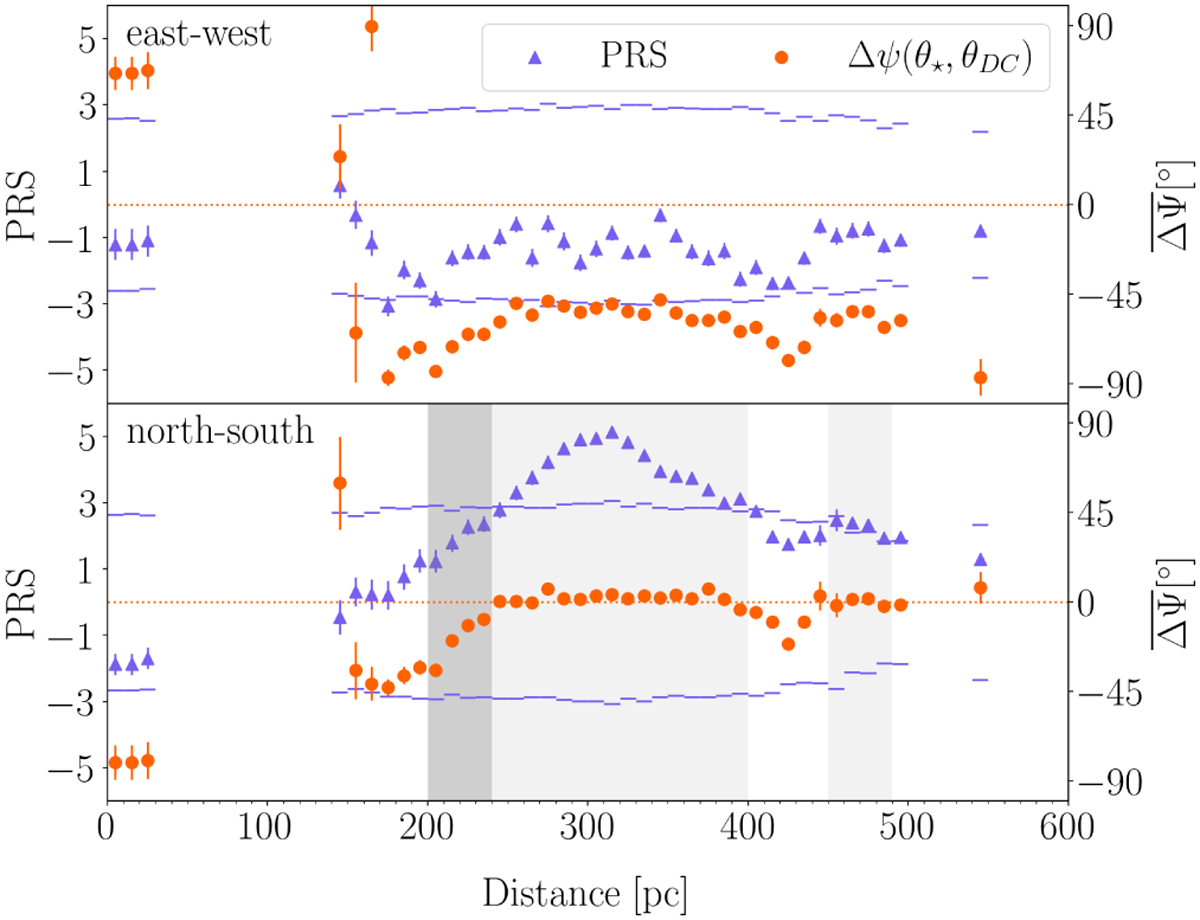
PRS values (purple triangles), their errors and the significance threshold (short, horizontal bars) calculated for angles Δψ, between starlight polarisation and depolarisation canals in the western region. Additionally, the Δψ (orange circles) and the associated error are shown. The result for each bin is represented by a data point located at its lower border. The two panels represent two distinct sets of orientations of depolarisation canals, as noted in the top left corner of each panel. Lighter shaded area represents all bins in which we find alignment, while the darker shaded area marks the estimated minimum distance range.
Current usage metrics show cumulative count of Article Views (full-text article views including HTML views, PDF and ePub downloads, according to the available data) and Abstracts Views on Vision4Press platform.
Data correspond to usage on the plateform after 2015. The current usage metrics is available 48-96 hours after online publication and is updated daily on week days.
Initial download of the metrics may take a while.