Fig. 4
Download original image
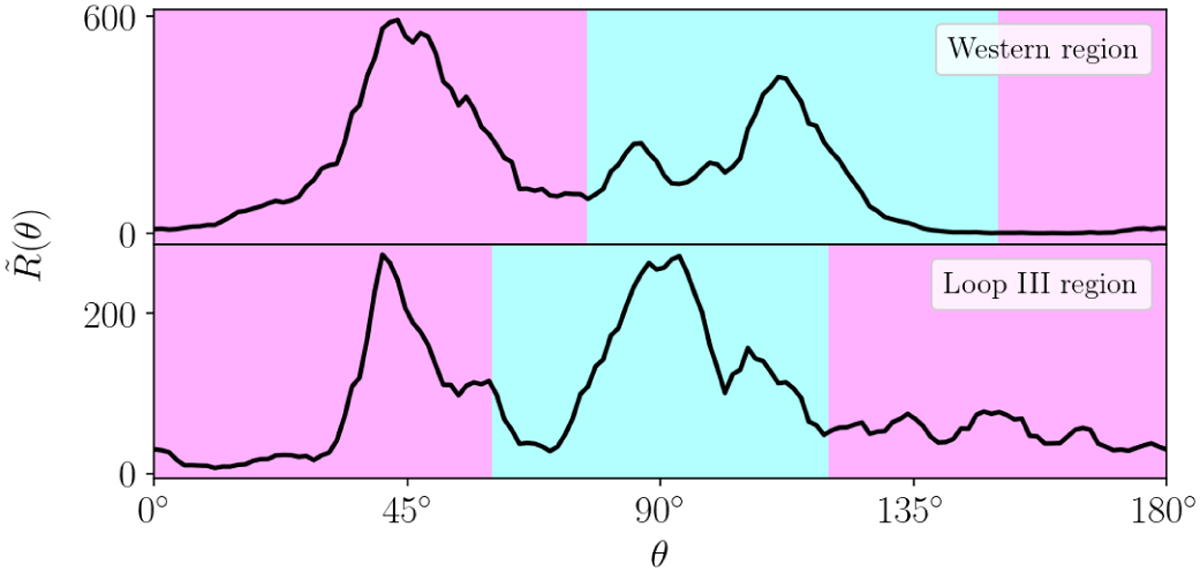
Distribution of the orientation of depolarisation canals in the western region, shown in the upper panel. Angles highlighted in cyan and magenta represent the east-west and the north-south orientation, respectively. The distribution of the orientation of depolarisation canals in the Loop III region is shown in the lower panel. Angles highlighted in cyan and magenta represent the depolarisation canals perpendicular and parallel to the loop, respectively.
Current usage metrics show cumulative count of Article Views (full-text article views including HTML views, PDF and ePub downloads, according to the available data) and Abstracts Views on Vision4Press platform.
Data correspond to usage on the plateform after 2015. The current usage metrics is available 48-96 hours after online publication and is updated daily on week days.
Initial download of the metrics may take a while.