Open Access
Fig. 2
Download original image
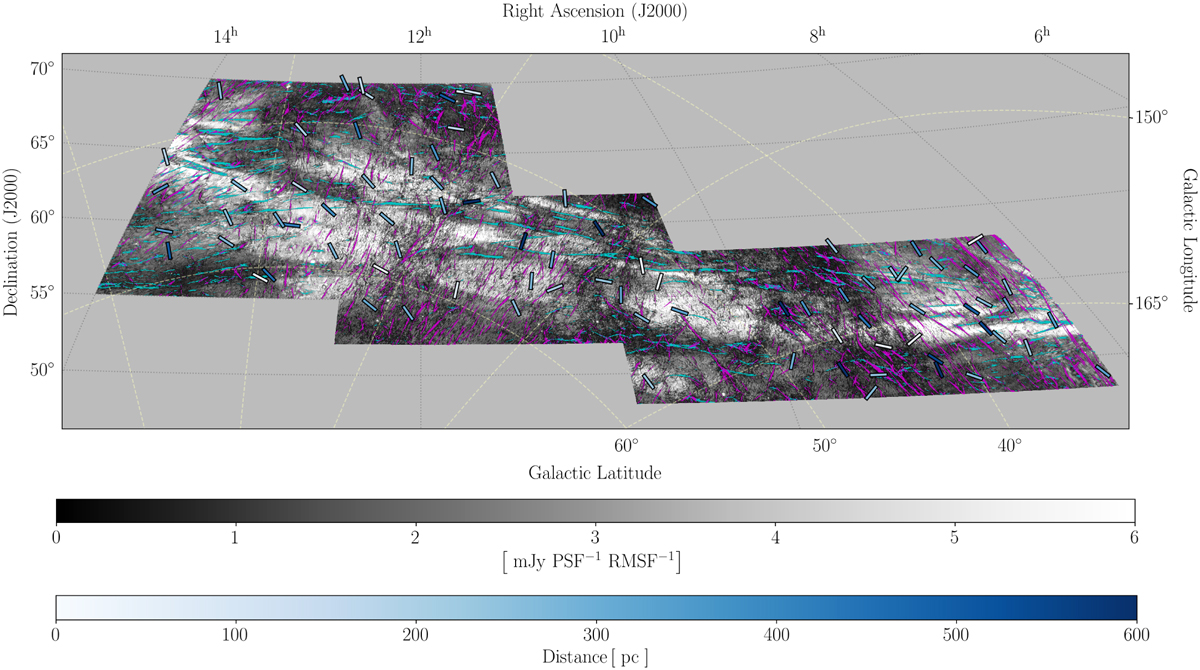
Zoom on the maximum polarised intensity image in the Loop III region. Cyan and magenta lines represent the depolarisation canals perpendicular and parallel to the loop, respectively. Blue bars represent the orientation of starlight polarisation angles, while the distance to the stars is indicated by the lower colour bar.
Current usage metrics show cumulative count of Article Views (full-text article views including HTML views, PDF and ePub downloads, according to the available data) and Abstracts Views on Vision4Press platform.
Data correspond to usage on the plateform after 2015. The current usage metrics is available 48-96 hours after online publication and is updated daily on week days.
Initial download of the metrics may take a while.