Fig. 10
Download original image
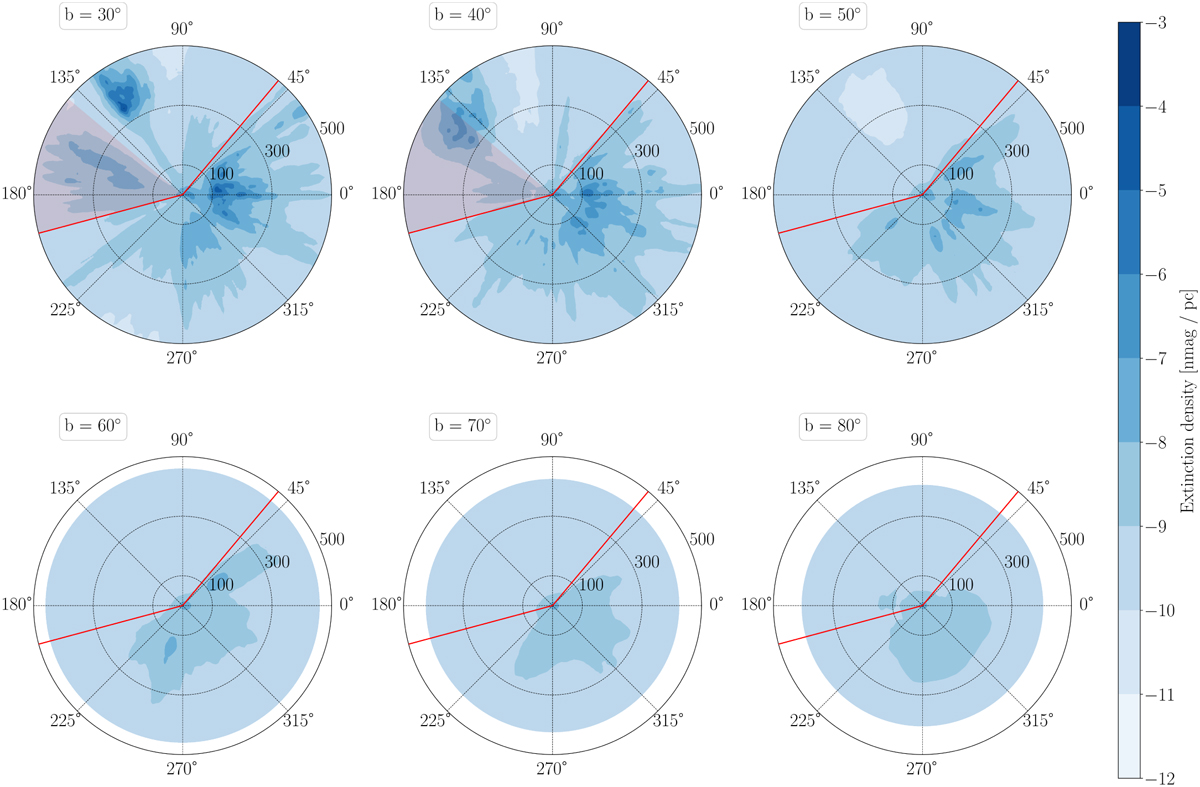
Dust extinction maps created using Vergely et al. (2022) data. The maps are plotted in Galactic coordinates, with the Sun in the centre. The angular coordinate denotes different Galactic longitudes, and the radial coordinate represents the distance from the Sun. Each panel is at a different Galactic latitude. Red lines represent borders of the LoTSS mosaic, and red shaded areas mark the location of the western region.
Current usage metrics show cumulative count of Article Views (full-text article views including HTML views, PDF and ePub downloads, according to the available data) and Abstracts Views on Vision4Press platform.
Data correspond to usage on the plateform after 2015. The current usage metrics is available 48-96 hours after online publication and is updated daily on week days.
Initial download of the metrics may take a while.