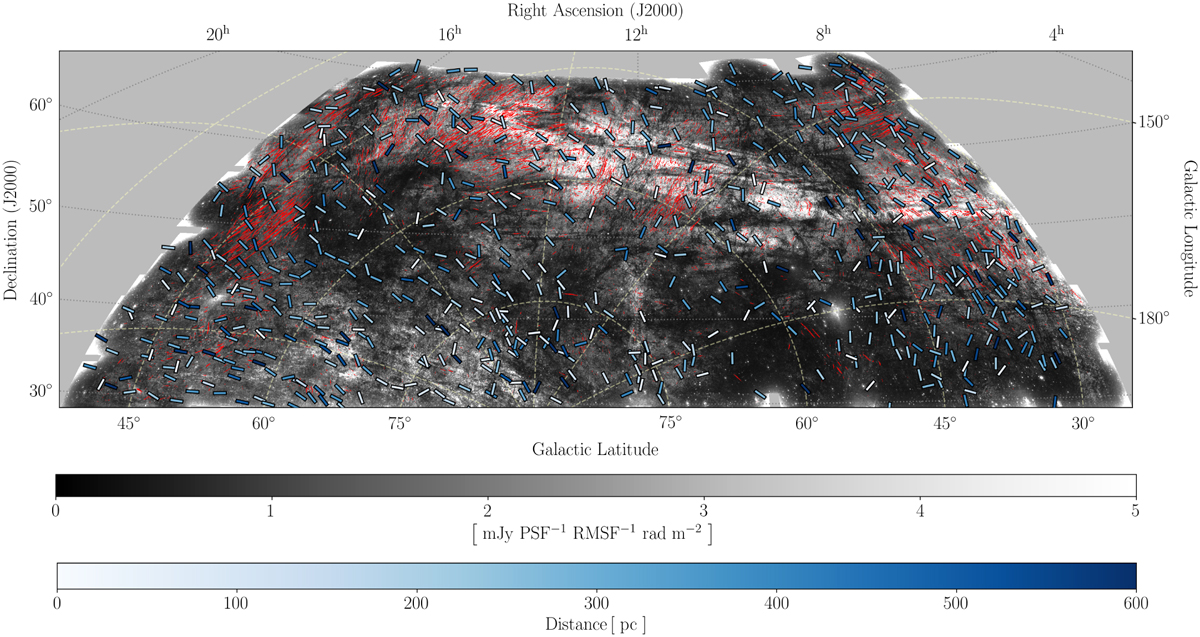
Fig. 1
Download original image
RHT backprojection depicting depolarisation canals (red lines) overplotted on the maximum polarised intensity image of the whole LoTSS mosaic. The blue bars on top of the two represent the sample of starlight polarisation measurements. They are coloured according to their distance, as indicated by the lower colour bar. The orientation of the lines represents the orientation of the starlight polarisation angle in the same projection as the LoTSS data.
Current usage metrics show cumulative count of Article Views (full-text article views including HTML views, PDF and ePub downloads, according to the available data) and Abstracts Views on Vision4Press platform.
Data correspond to usage on the plateform after 2015. The current usage metrics is available 48-96 hours after online publication and is updated daily on week days.
Initial download of the metrics may take a while.