Fig. A.1
Download original image
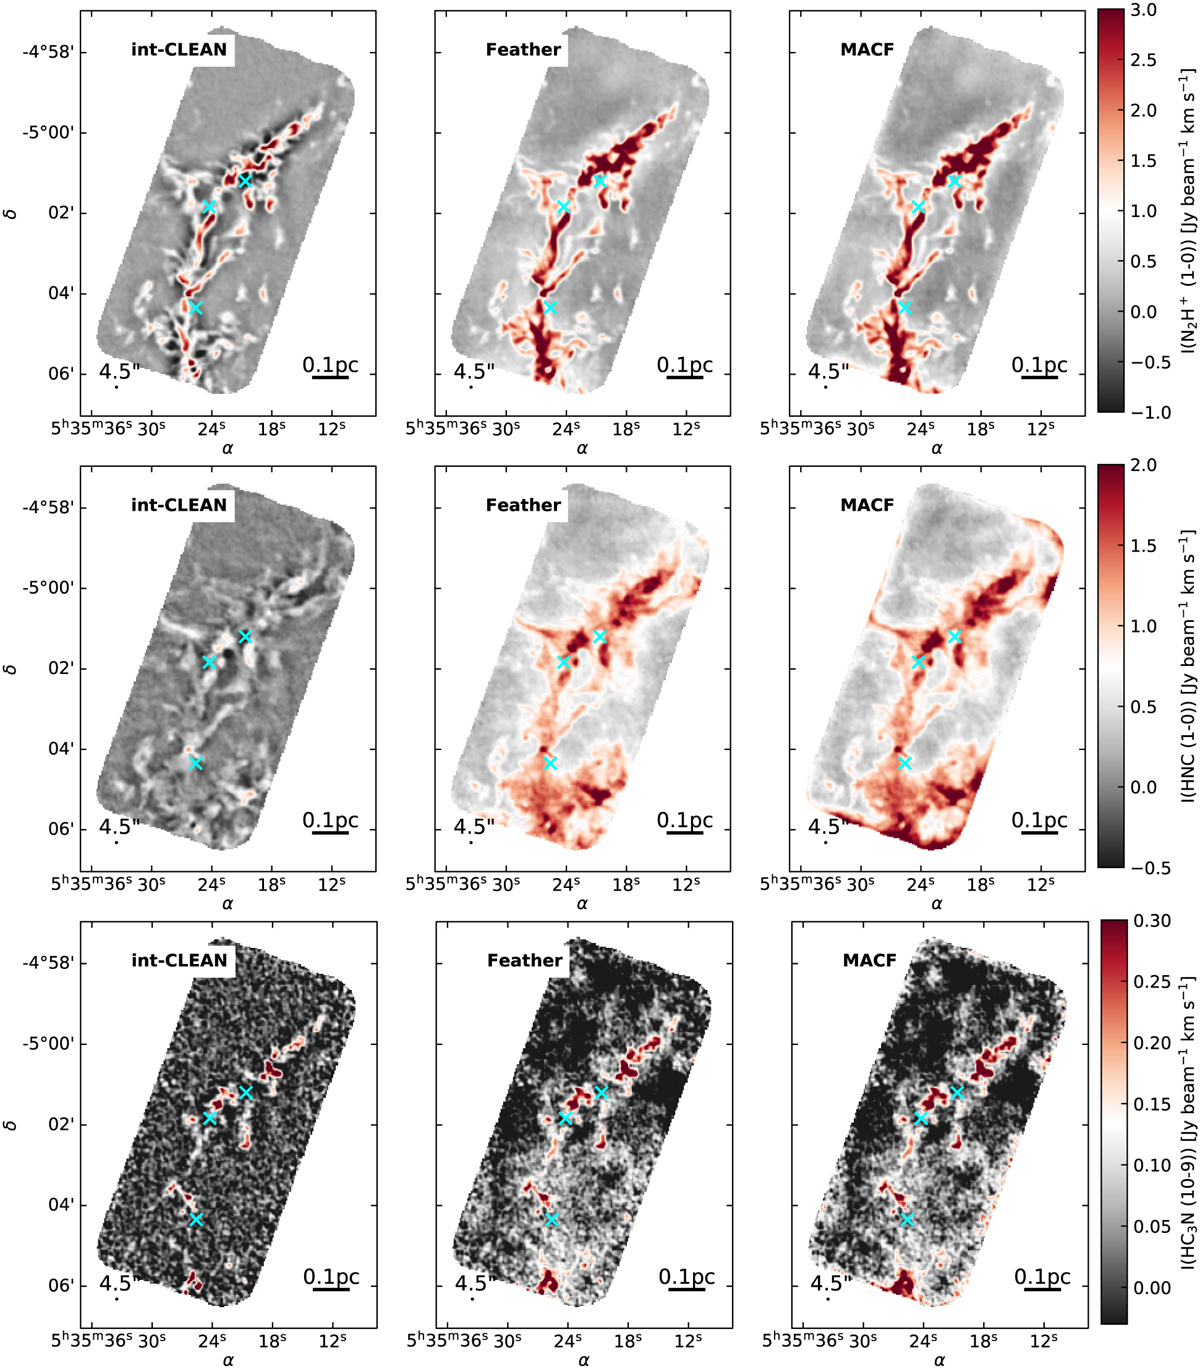
Effects of the different data combination methods in OMC-3: (Top) N2H+ (1–0), (middle) HNC (1–0), and (bottom) HC3N (10–9) integrated intensity maps. The different columns show the results for the (left) interferometric-alone (int-CLEAN), (centre) feather (Feather), and (right) Model Assisted CLEAN plus Feather (MACF) data combination methods. To facilitate their comparison all integrated-intensity maps of the same molecule are displayed with the same intensity scale (see color bars). The location of the spectra shown in Fig. A.3 is indicated by cyan crosses in all maps. Compared to our standard PB cut above 0.5 (Sec. 4.1), these maps are shown down to PB values of 0.2 in order to identify potential issues at their edges (e.g., HNC MACF map). We remark here that these edges issues do not affect our scientific results as they are removed when our stricter PB cut is applied. Similar features can be identified in all the ALMA fields observed in these three tracers shown in Figs. B.13–B.16.
Current usage metrics show cumulative count of Article Views (full-text article views including HTML views, PDF and ePub downloads, according to the available data) and Abstracts Views on Vision4Press platform.
Data correspond to usage on the plateform after 2015. The current usage metrics is available 48-96 hours after online publication and is updated daily on week days.
Initial download of the metrics may take a while.