Fig. 8
Download original image
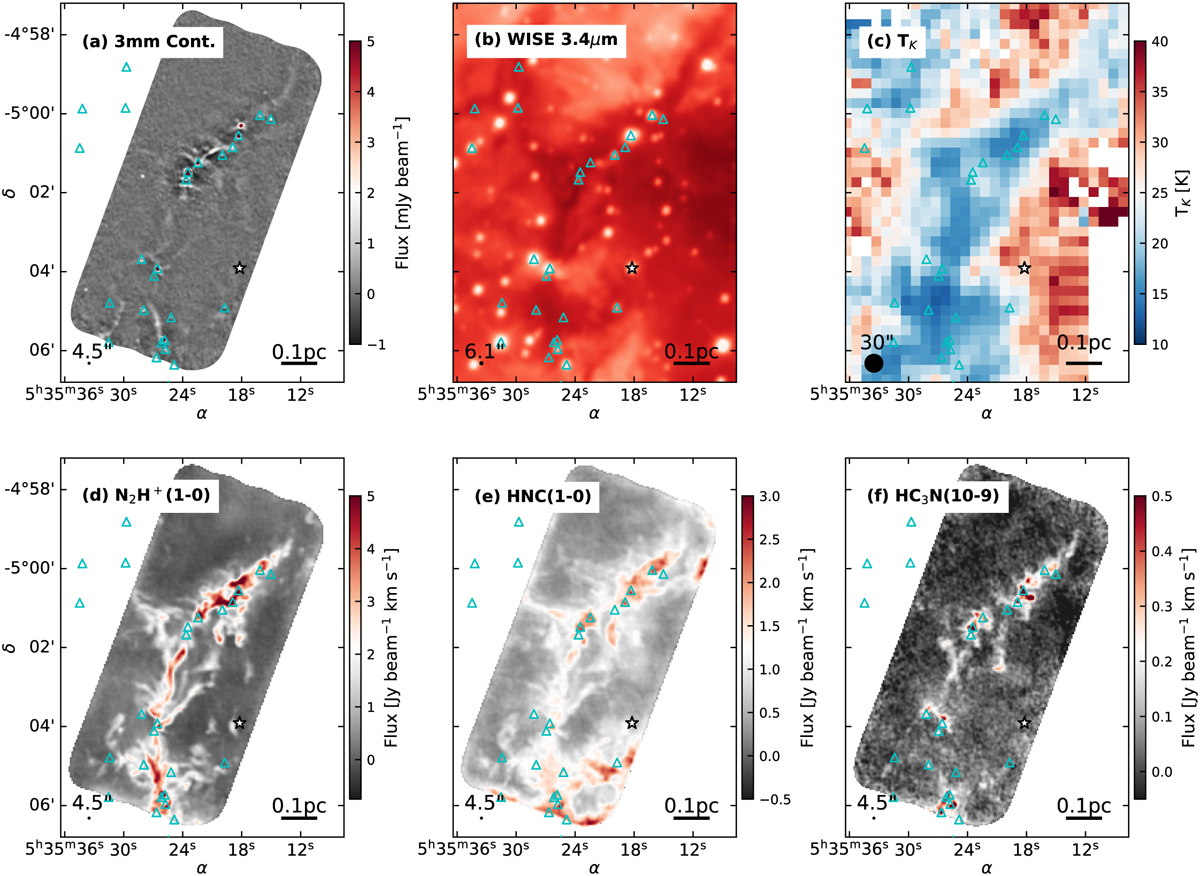
High-resolution observations in OMC-3. From left to right and from top to bottom: (a) ALMA interferometric-alone (int-CLEAN) continuum map (4″.5); (b) WISE 3.4 μm emission (6.1″); (c) gas kinetic temperature, TK(30″), (d) N2H+ (1–0), (e) HNC (1–0), and (f) HC3N (10–9) integrated-intensity maps obtained in our ALMA+IRAM-30 m MACF observations (4″.5). The symbols are similar to those in Fig. 1. Similar plots for all the other regions can be found in Appendix B. The enhanced resolution of our ALMA+IRAM-30 m maps (panels a, and d–f) can be seen from their comparison with the gas TK map (panel c) displayed at the single-dish resolution.
Current usage metrics show cumulative count of Article Views (full-text article views including HTML views, PDF and ePub downloads, according to the available data) and Abstracts Views on Vision4Press platform.
Data correspond to usage on the plateform after 2015. The current usage metrics is available 48-96 hours after online publication and is updated daily on week days.
Initial download of the metrics may take a while.