Fig. 7
Download original image
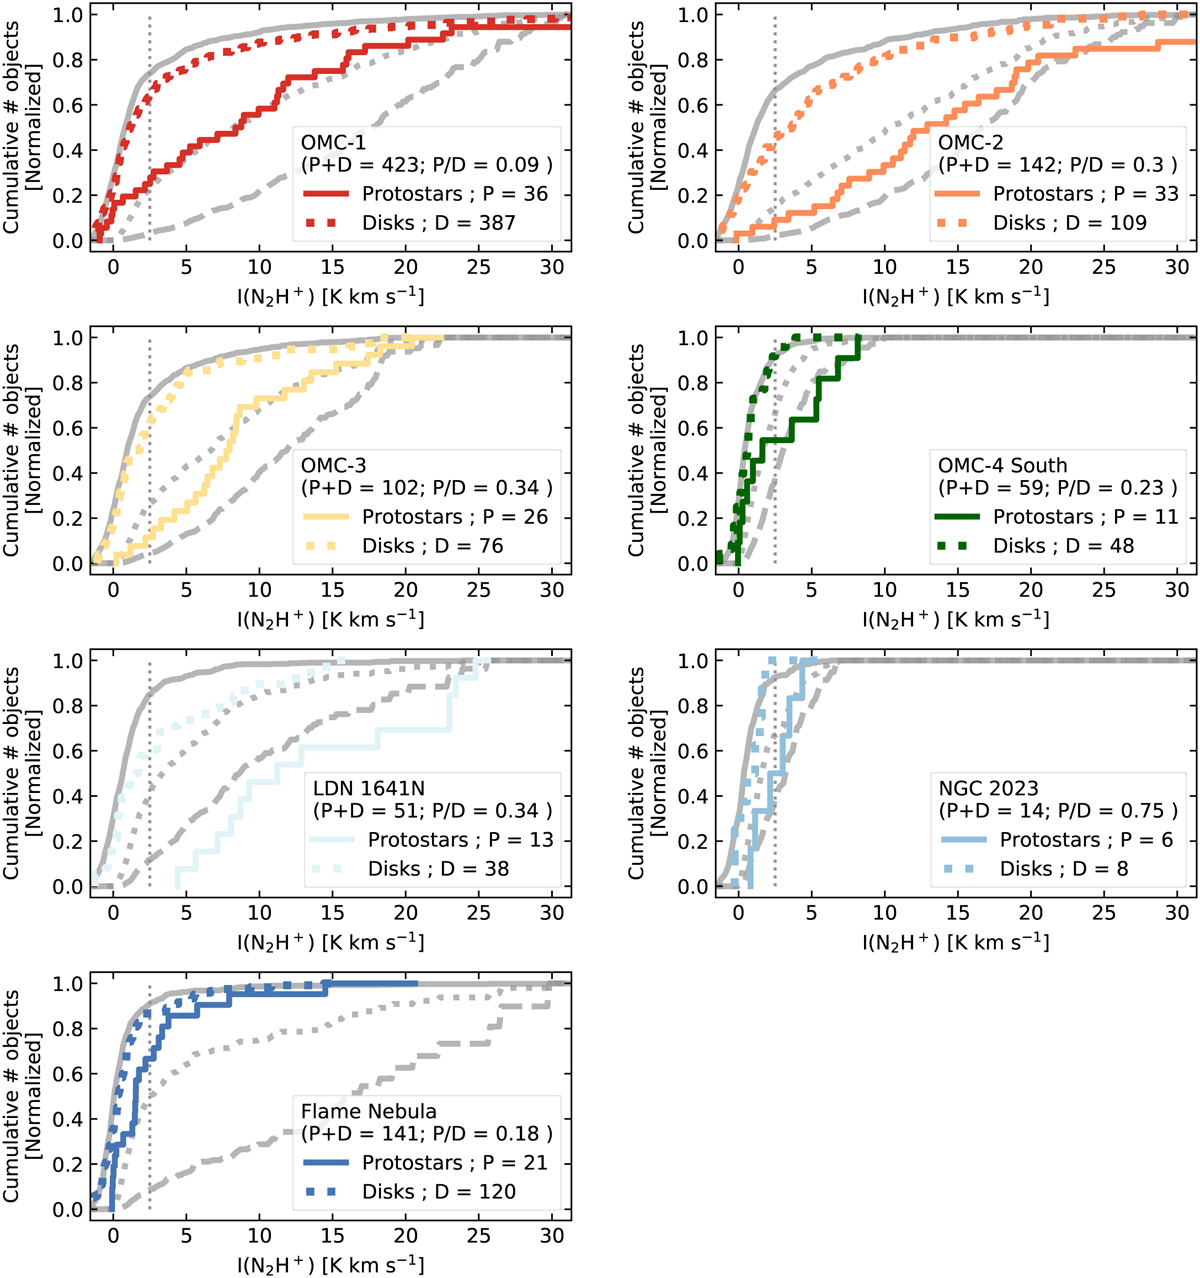
Cumulative distributions of the N2H+ (1–0) integrated emission I(N2H+) at the positions of protostars (solid colored line) and disk stars (dashed colored line) within the central 1.5×1.5 pc2 (~700×700 arcsec2) in each of the regions that are part of the EMERGE Early Science sample. All panels are displayed within the same ranges of N2H+ intensity to facilitate their comparison. In each subpanel, the local number of protostars (P) and disk stars (D), as well as their ratio (P/D), is indicated in the legend (see also Table 1). In each of these regions, the average result of simulating the expected cumulative distributions of a P+D number of objects following (a) a random distribution (solid gray line), (b) a linear dependence (dotted gray line), and (c) a quadratic dependence (dashed gray line) are shown in the corresponding panels.
Current usage metrics show cumulative count of Article Views (full-text article views including HTML views, PDF and ePub downloads, according to the available data) and Abstracts Views on Vision4Press platform.
Data correspond to usage on the plateform after 2015. The current usage metrics is available 48-96 hours after online publication and is updated daily on week days.
Initial download of the metrics may take a while.