Fig. 6
Download original image
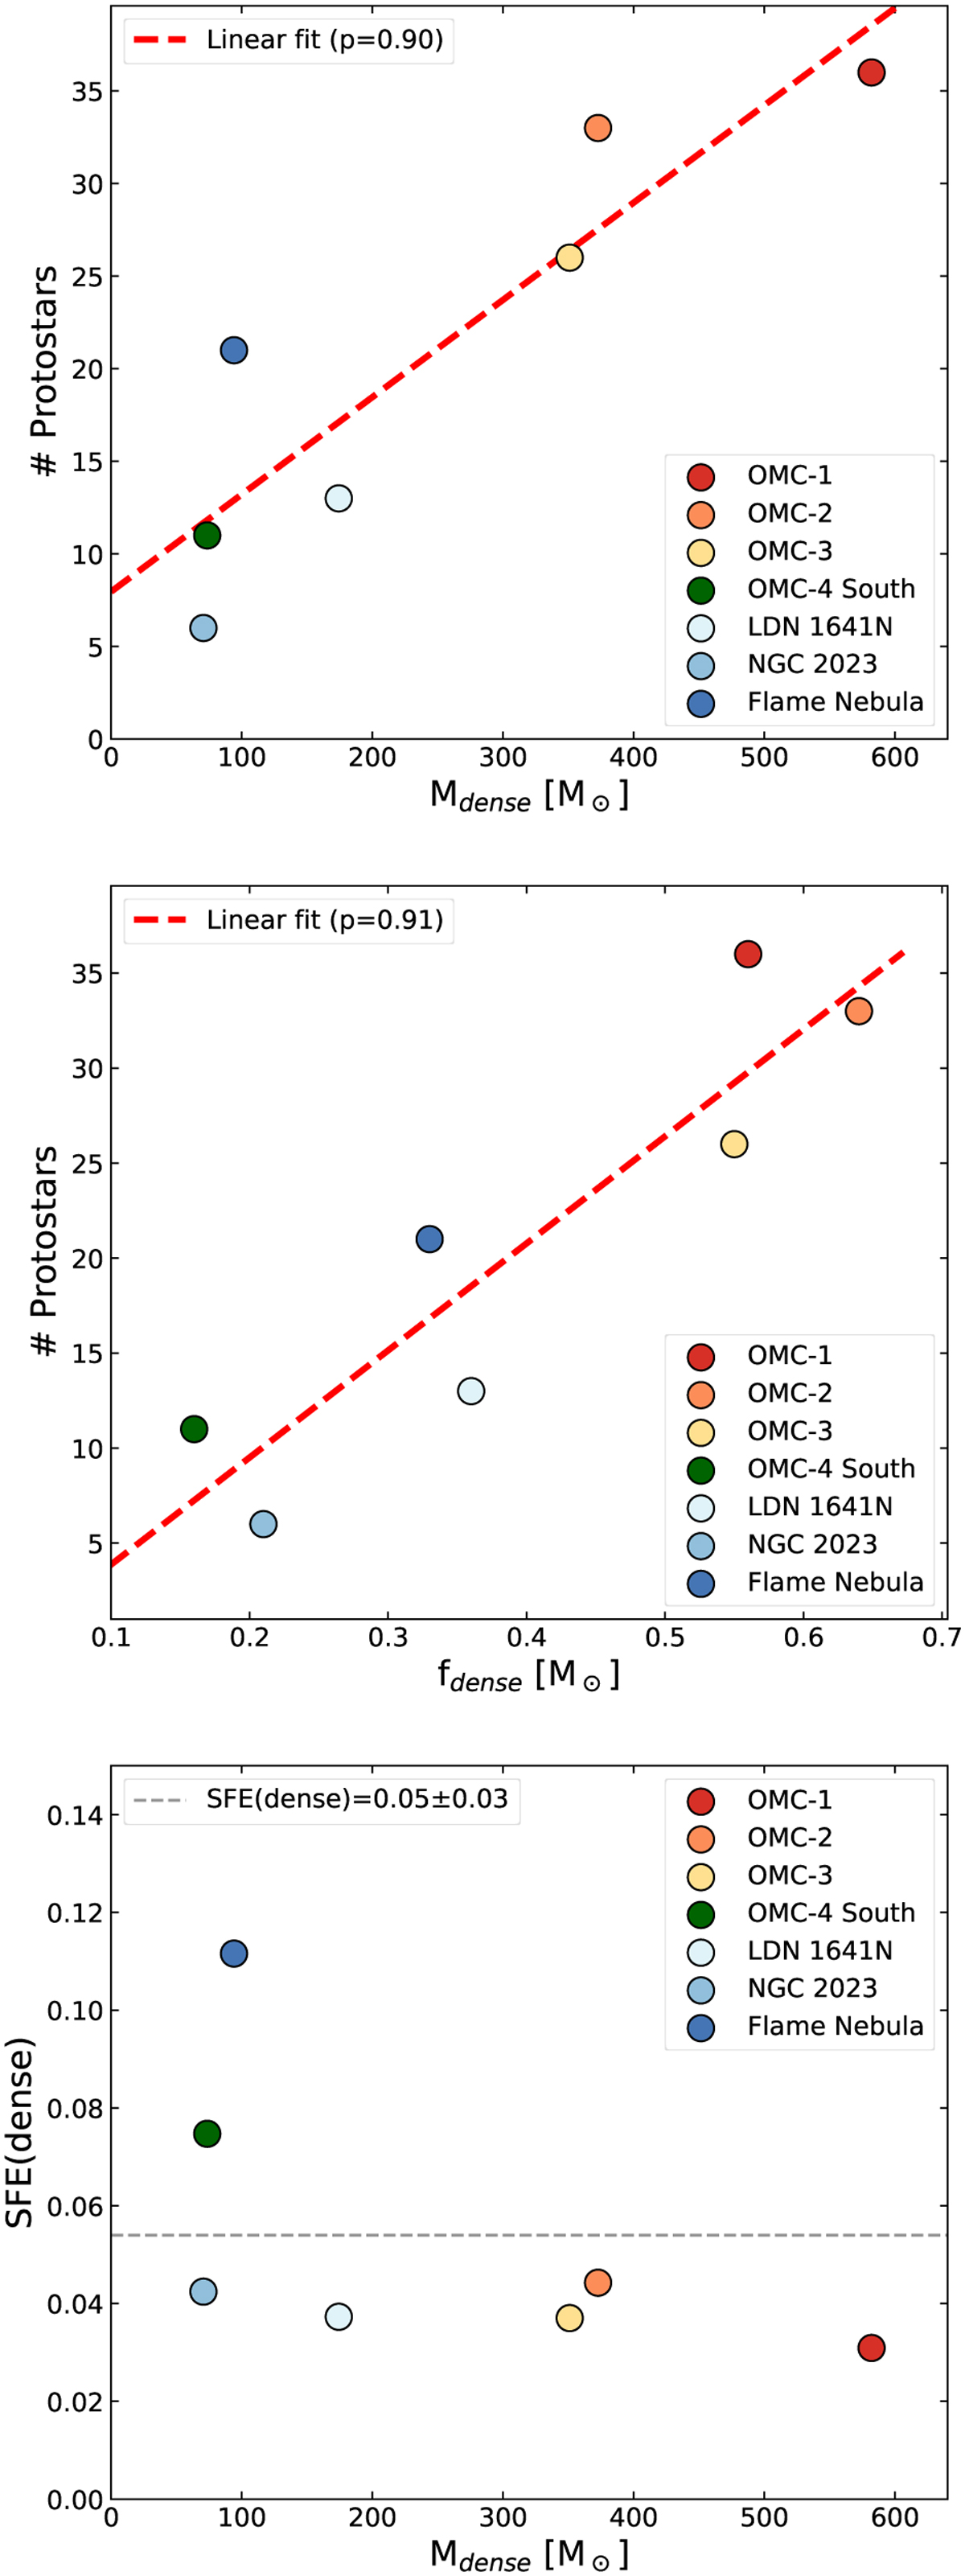
Star formation activity in the different regions explored in our sample (see legend). From top to bottom: (upper panel) number of protostars (P) with respect to the total amount of dense gas Mdense, (middle panel fraction of dense gas fdense, and (lower panel) star formation efficiency in the dense gas (see the values in Table 1). We display the linear fit of all our targets (dashed red line) and their corresponding Pearson p-coefficients (see the values in legend) in the upper and middle panels.
Current usage metrics show cumulative count of Article Views (full-text article views including HTML views, PDF and ePub downloads, according to the available data) and Abstracts Views on Vision4Press platform.
Data correspond to usage on the plateform after 2015. The current usage metrics is available 48-96 hours after online publication and is updated daily on week days.
Initial download of the metrics may take a while.