Fig. 5

Download original image
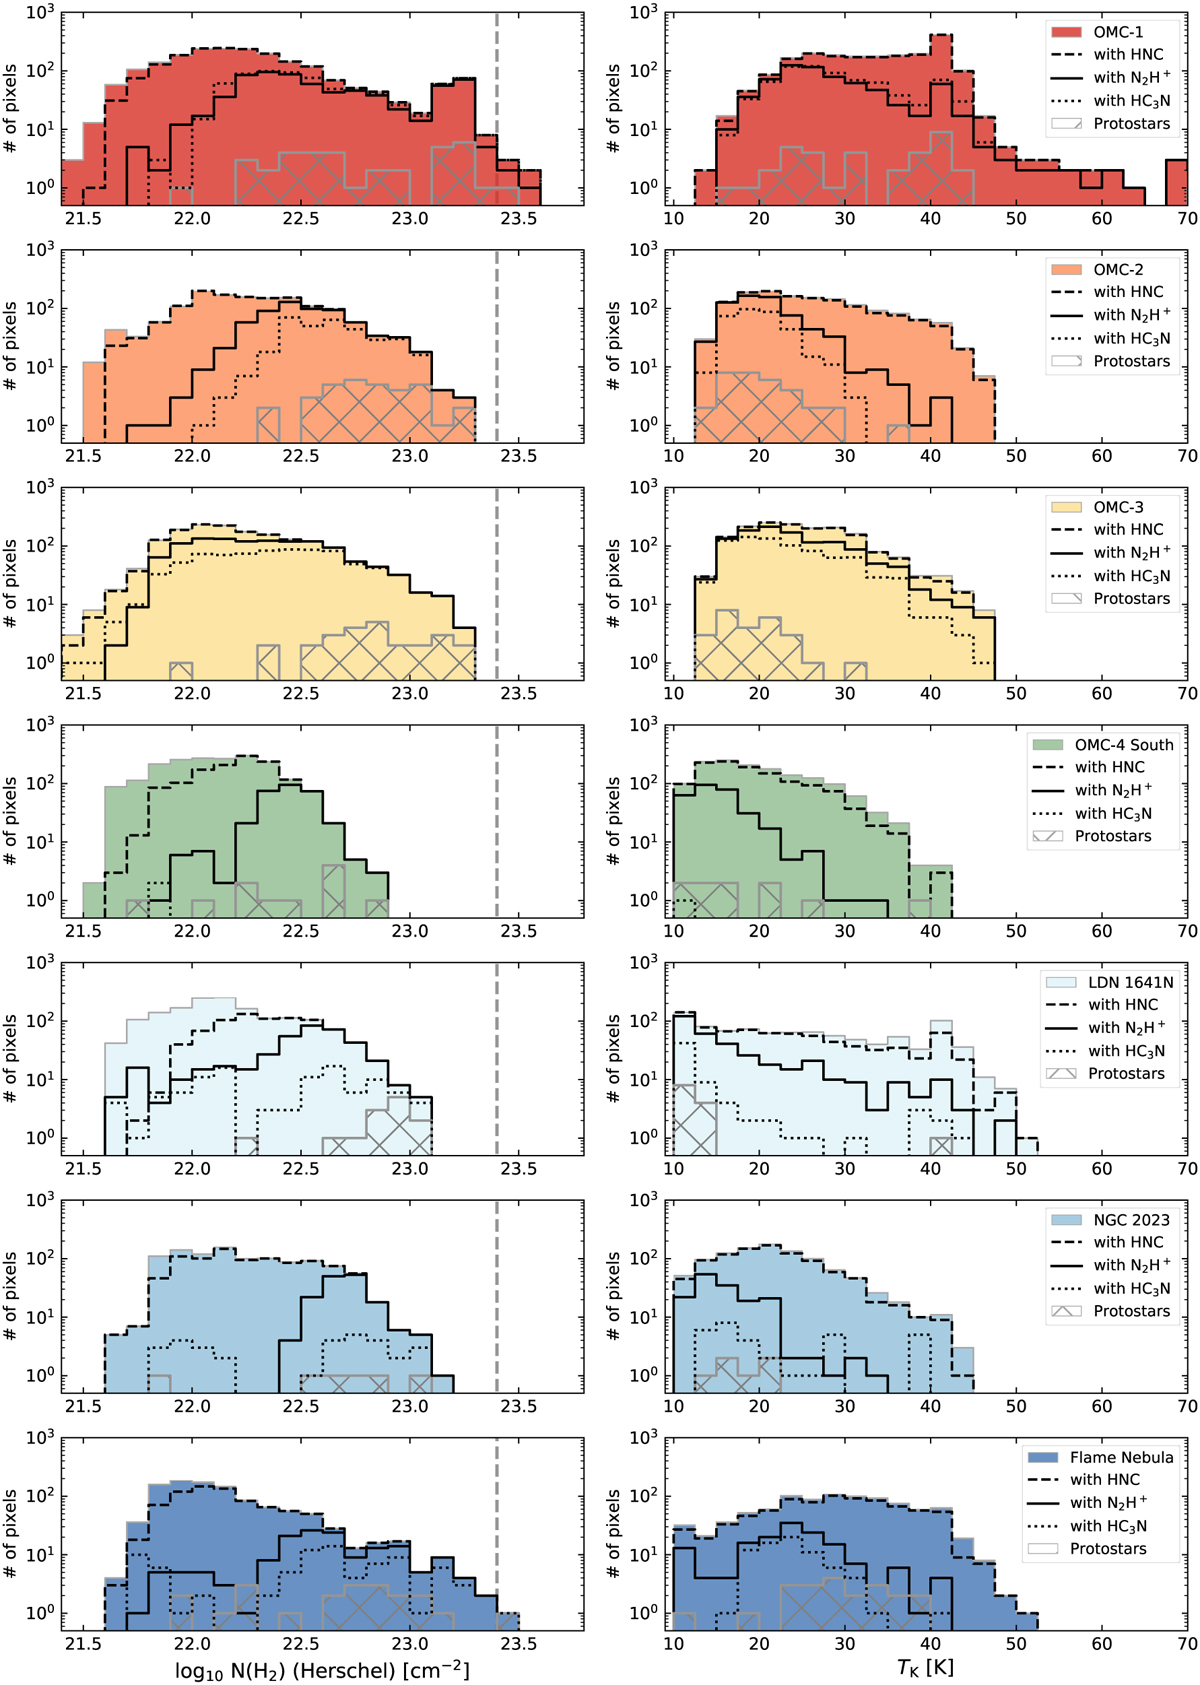
Histograms of the (left) gas column density N(H2) and (right) gas kinetic temperature TK distributions detected at low spatial resolution (Herschel or IRAM-30m) within the central 1.5×1.5 pc2 (~700×700 arcsec2) of all regions part of the EMERGE Early ALMA Survey (see also Tables 1 and 2). From top to bottom: OMC-1, OMC-2, OMC-3, OMC-4 South, LDN 1641N, NGC 2023, and Flame Nebula. Positions showing detected emission above the first contour in Fig. 4 (and Figs. B.1–B.6) of HNC (black dashed lines), N2H+ (black solid lines), and HC3N (black dotted lines), as well as including protostars (hatched gray areas) are highlighted in all histograms. A vertical gray dashed line in the N(H2) histograms indicates the minimum column density of 1023.4 cm−2 (or 1 g cm−2) needed to form a high-mass star (Krumholz & McKee 2008).
Current usage metrics show cumulative count of Article Views (full-text article views including HTML views, PDF and ePub downloads, according to the available data) and Abstracts Views on Vision4Press platform.
Data correspond to usage on the plateform after 2015. The current usage metrics is available 48-96 hours after online publication and is updated daily on week days.
Initial download of the metrics may take a while.


