Fig. 4
Download original image
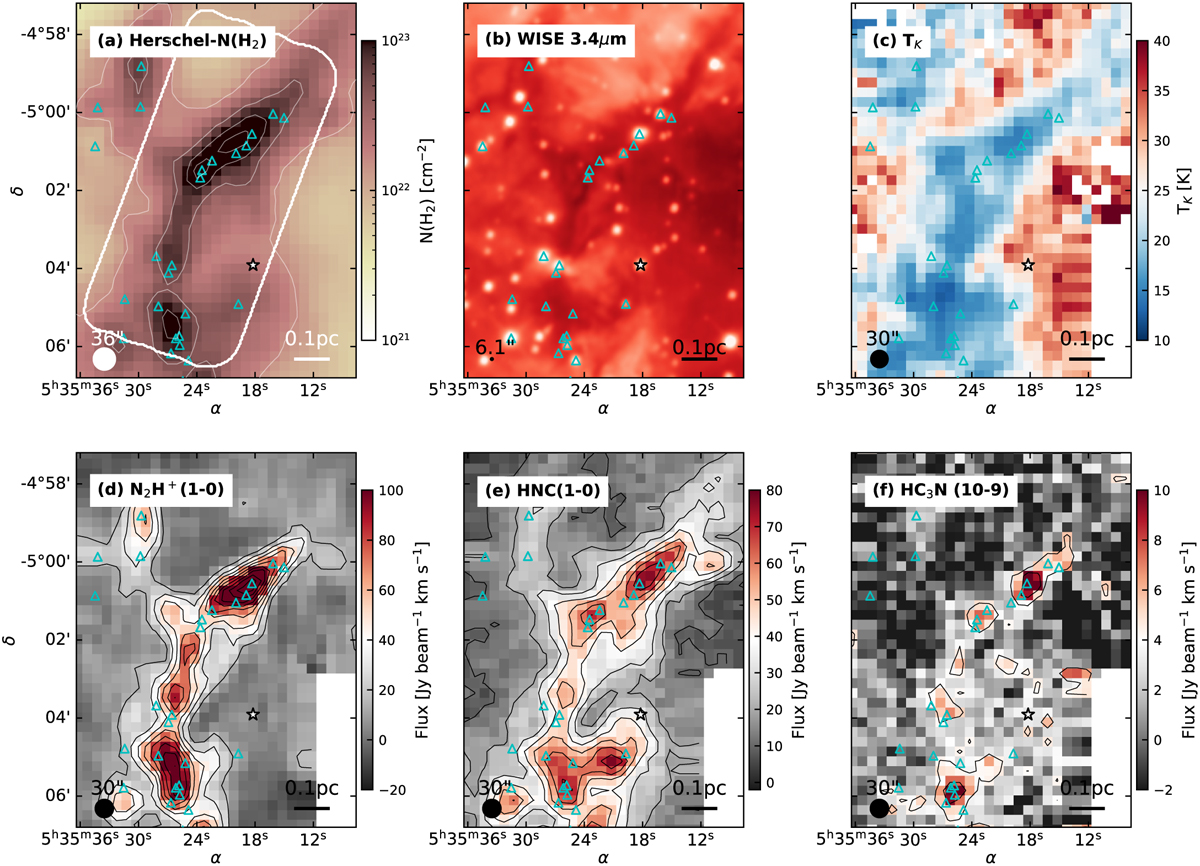
Low-resolution observations in OMC-3. From left to right and from top to bottom we plot (a) Herschel, total gas column density, N(H2) (36″); (b) WISE 3.4 μm emission (6.1″); (c) gas kinetic temperature, TK, (d) N2H+ (1–0), (e) HNC (1–0), and (f) HC3N (10–9) integrated intensity maps obtained in our IRAM-30 m (broad) observations (30″). The symbols are similar to those in Fig. 1. The corresponding beam size and scale bar are indicated in the lower corner of each panel. For reference, panel a includes contours at N(H2) = [15, 50, 100, 150, 200] ×1021 cm−2 and the footprint of our ALMA observations shown in Fig. 8. Similar plots for all the other regions can be found in Appendix B.
Current usage metrics show cumulative count of Article Views (full-text article views including HTML views, PDF and ePub downloads, according to the available data) and Abstracts Views on Vision4Press platform.
Data correspond to usage on the plateform after 2015. The current usage metrics is available 48-96 hours after online publication and is updated daily on week days.
Initial download of the metrics may take a while.