Fig. A.4
Download original image
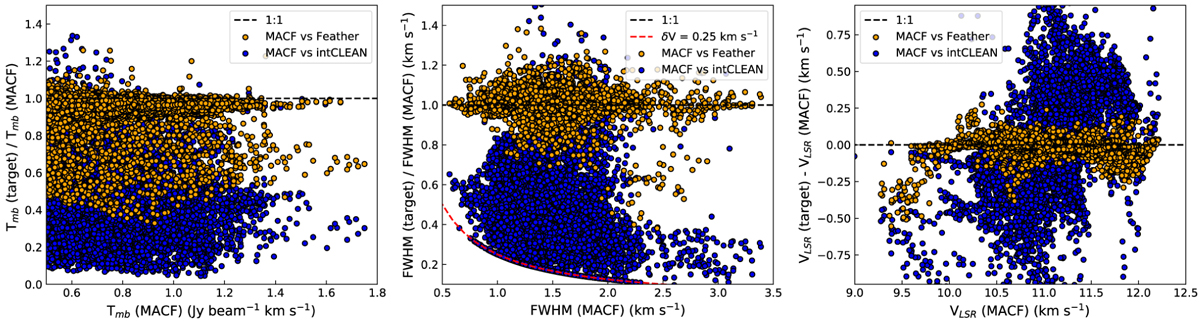
HNC (1–0) line properties derived from the automatic fit of one Gaussian component in OMC-3 obtained from our int-CLEAN (blue points) and Feather (yellow points) reductions (targets) in comparison with MACF. For simplicity, only fits with I(HNC, MACF)≥0.5 Jy beam−1 and S/N≥5 are shown. From left to right: (Left panel) Line peak ratio; (central panel) full width at half maximum ratio; (right panel) Velocity difference. The lower envelope of the central panel is determined by the spectral resolution of our (narrow) reductions with δV=0.25 km s−1.
Current usage metrics show cumulative count of Article Views (full-text article views including HTML views, PDF and ePub downloads, according to the available data) and Abstracts Views on Vision4Press platform.
Data correspond to usage on the plateform after 2015. The current usage metrics is available 48-96 hours after online publication and is updated daily on week days.
Initial download of the metrics may take a while.