Fig. 1
Download original image
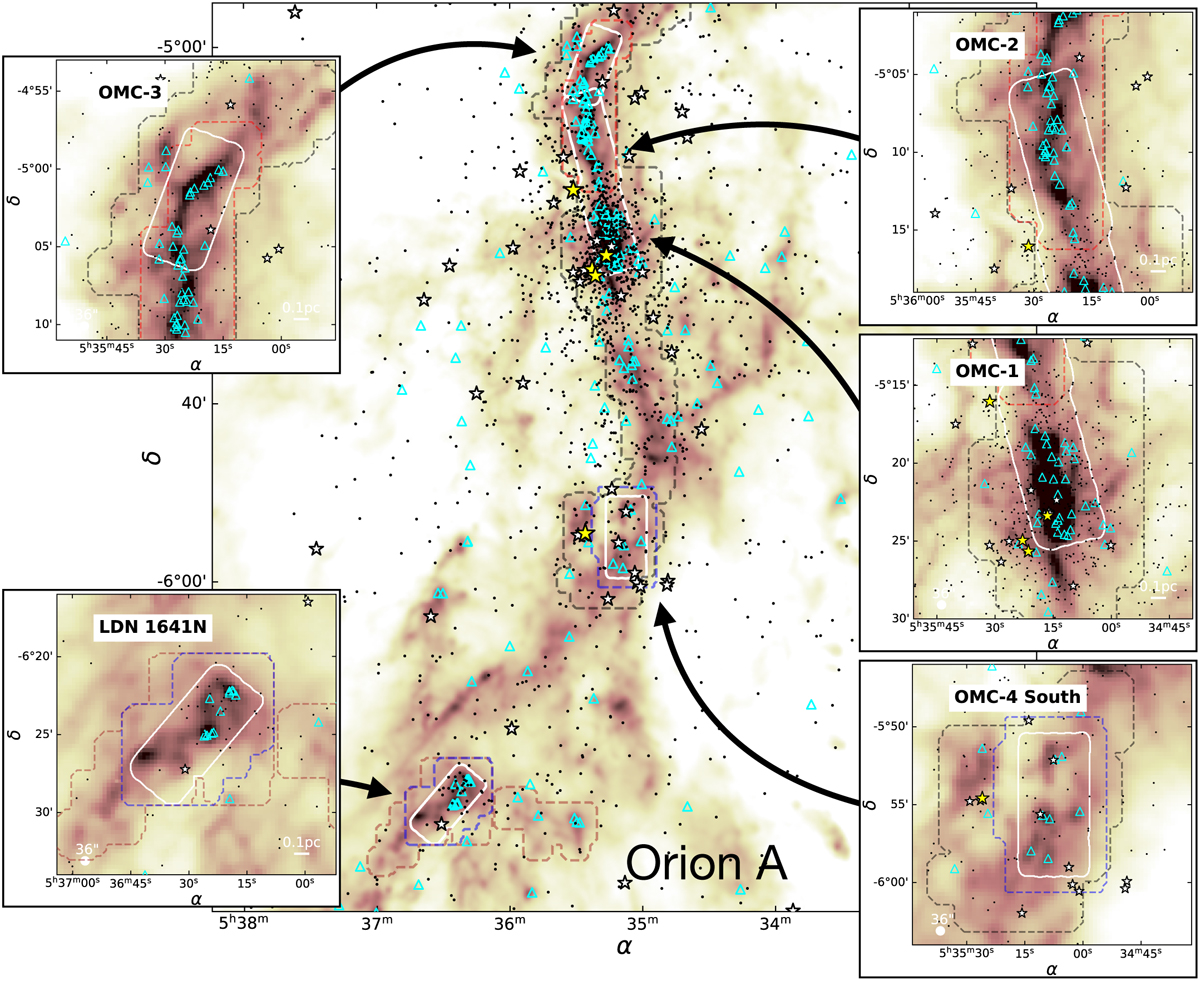
EMERGE Early ALMA Survey in Orion A (central panel), including zoom-ins of the OMC-1, OMC-2, OMC-3, OMC-4 South, and LDN 1641N regions (see subpanels), shown over the total gas column density derived from Herschel observations (background image at 36 arcsec resolution; Lombardi et al. 2014). The footprints of our ALMA mosaics (white lines) as well as our IRAM-30 m observations (colored lines; see color-code in Table 3) are indicated in all panels together with the positions of O (yellow stars) and B stars (white stars) at the distance of Orion. The positions of young protostars (cyan triangles) and disk stars (black dots) (Megeath et al. 2012) and the corresponding Herschel beam size and 0.1 pc scale bar are marked in the individual zoom-ins.
Current usage metrics show cumulative count of Article Views (full-text article views including HTML views, PDF and ePub downloads, according to the available data) and Abstracts Views on Vision4Press platform.
Data correspond to usage on the plateform after 2015. The current usage metrics is available 48-96 hours after online publication and is updated daily on week days.
Initial download of the metrics may take a while.