Fig. 9
Download original image
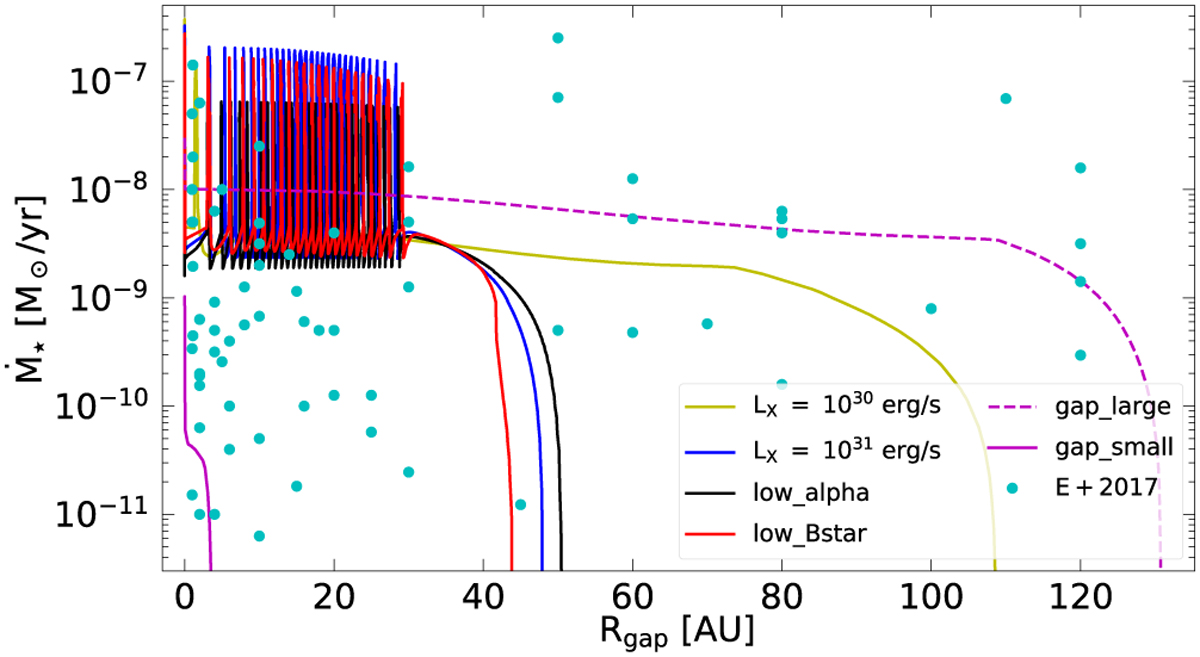
Gap radius, Rgap, with respect to the accretion rate, ![]() , (‘
, (‘![]() ’-wall) for the models from Table 2 that trigger accretion events. The cyan dots represent observational data taken from Ercolano & Pascucci (2017) (labelled as ‘E+2017’). To indicate the possible range of our models, we added two additional models: ‘gap_large’ and ‘gap_small’. The models ‘gap_large’ and ‘gap_small’ have initial accretion rates of
’-wall) for the models from Table 2 that trigger accretion events. The cyan dots represent observational data taken from Ercolano & Pascucci (2017) (labelled as ‘E+2017’). To indicate the possible range of our models, we added two additional models: ‘gap_large’ and ‘gap_small’. The models ‘gap_large’ and ‘gap_small’ have initial accretion rates of ![]() and
and ![]() and X-ray luminosities of 1030 erg s−1 and 1029 erg s−1 were assumed, respectively. These models range from small accretion rates and small gap sizes in the lower-left corner to large gap sizes with accretion rates of ≲3 × 10⁻⁹ M⊙ yr−1 (lower-right side of the plot).
and X-ray luminosities of 1030 erg s−1 and 1029 erg s−1 were assumed, respectively. These models range from small accretion rates and small gap sizes in the lower-left corner to large gap sizes with accretion rates of ≲3 × 10⁻⁹ M⊙ yr−1 (lower-right side of the plot).
Current usage metrics show cumulative count of Article Views (full-text article views including HTML views, PDF and ePub downloads, according to the available data) and Abstracts Views on Vision4Press platform.
Data correspond to usage on the plateform after 2015. The current usage metrics is available 48-96 hours after online publication and is updated daily on week days.
Initial download of the metrics may take a while.