Fig. 7
Download original image
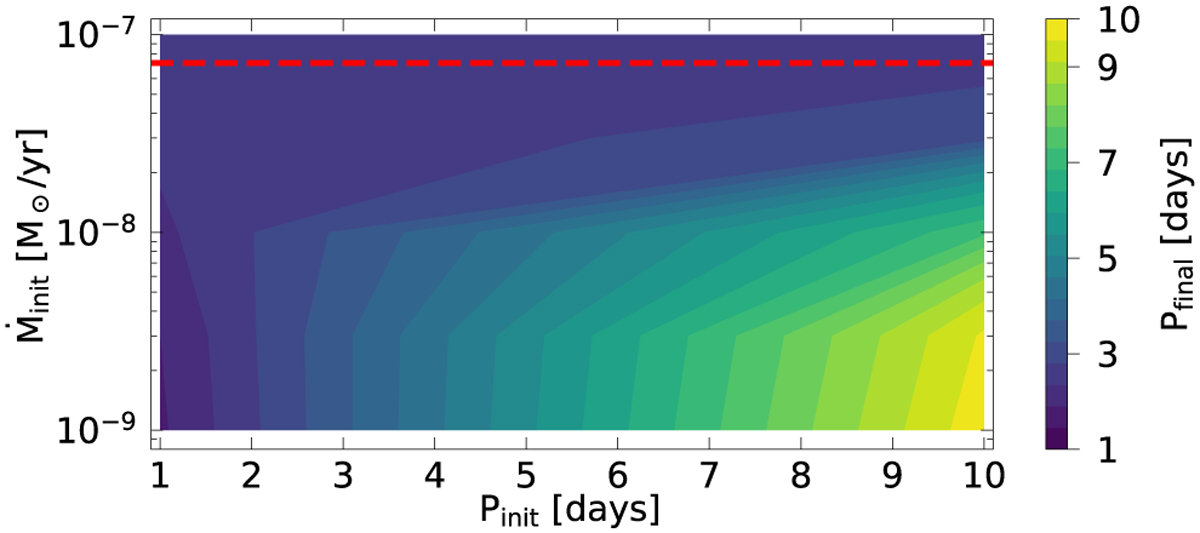
Contour lines showing the final stellar rotation period, Pfinal, after the simulation was completed for different initial accretion rates, ![]() , and initial stellar rotation periods, Pinit. The X-ray luminosity for all models shown in this figure is 1030 erg s−1. The horizontal dashed line indicates the initial accretion rate, at which Pfinal differ by a maximum of 2%.
, and initial stellar rotation periods, Pinit. The X-ray luminosity for all models shown in this figure is 1030 erg s−1. The horizontal dashed line indicates the initial accretion rate, at which Pfinal differ by a maximum of 2%.
Current usage metrics show cumulative count of Article Views (full-text article views including HTML views, PDF and ePub downloads, according to the available data) and Abstracts Views on Vision4Press platform.
Data correspond to usage on the plateform after 2015. The current usage metrics is available 48-96 hours after online publication and is updated daily on week days.
Initial download of the metrics may take a while.