Fig. 3
Download original image
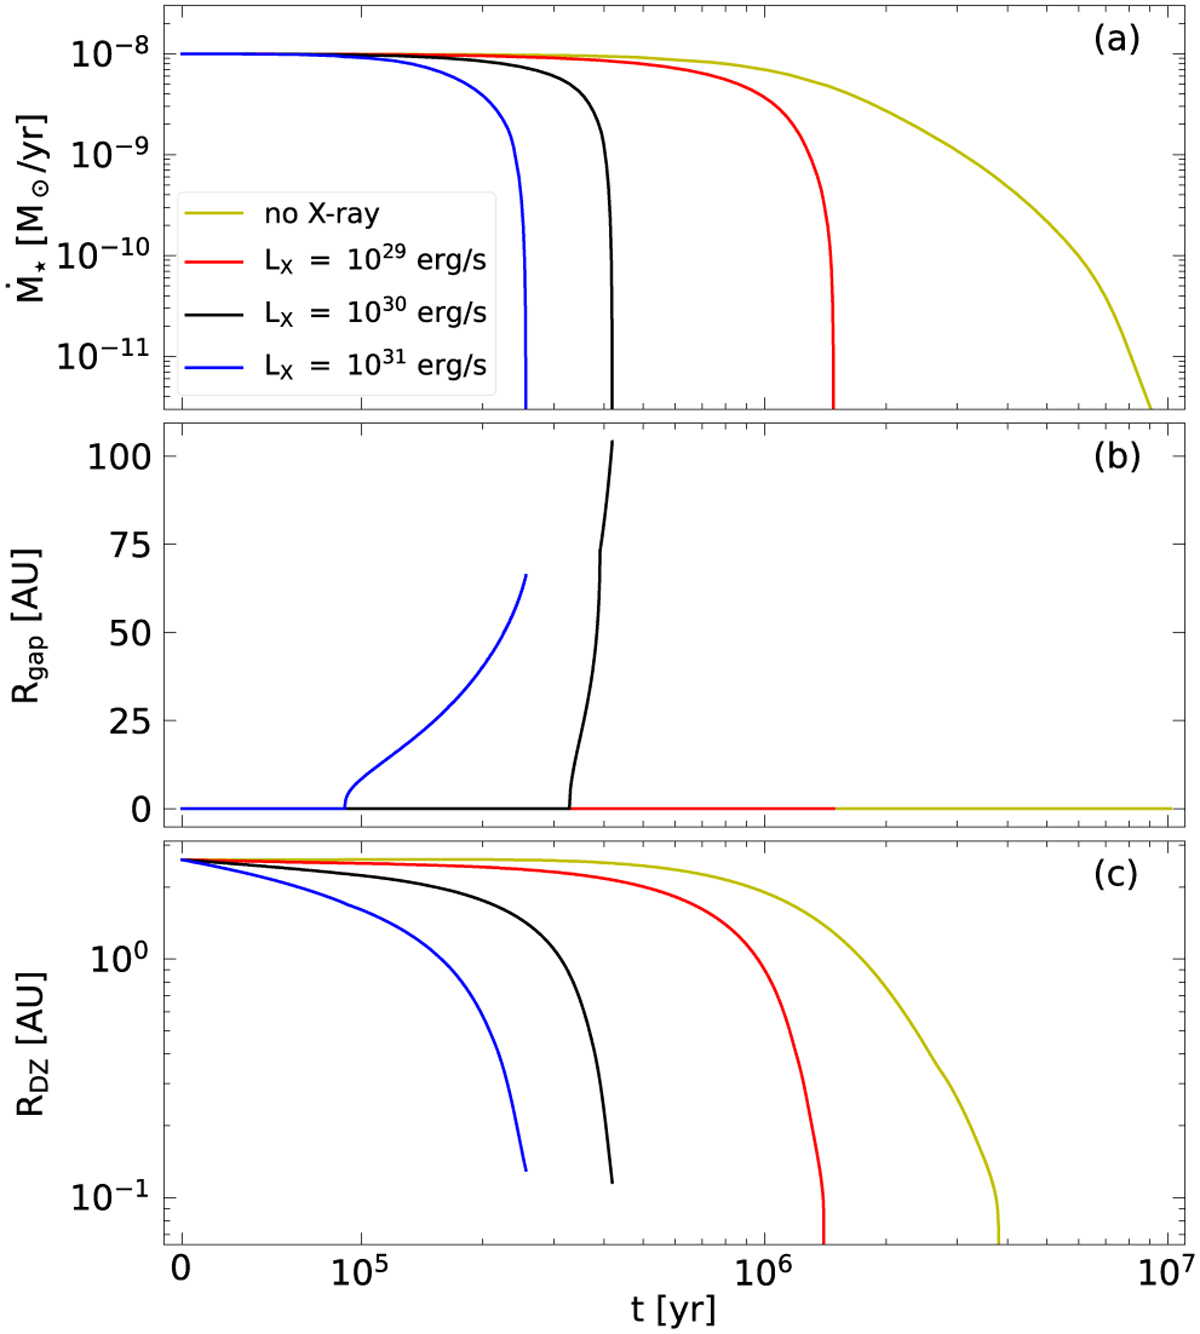
Disk evolution for different X-ray luminosities. The blue, black, red, and yellow lines correspond to an X-ray luminosity of LX = 1031, 1030, 1029 ergs−1, and no X-ray luminosity, respectively. Panel a, b, and c show the mass accretion rate on the star, ![]() ; the width of the photoevaporative gap, Rgap; and the outer edge of the dead zone, RDZ, respectively.
; the width of the photoevaporative gap, Rgap; and the outer edge of the dead zone, RDZ, respectively.
Current usage metrics show cumulative count of Article Views (full-text article views including HTML views, PDF and ePub downloads, according to the available data) and Abstracts Views on Vision4Press platform.
Data correspond to usage on the plateform after 2015. The current usage metrics is available 48-96 hours after online publication and is updated daily on week days.
Initial download of the metrics may take a while.