Fig. 2
Download original image
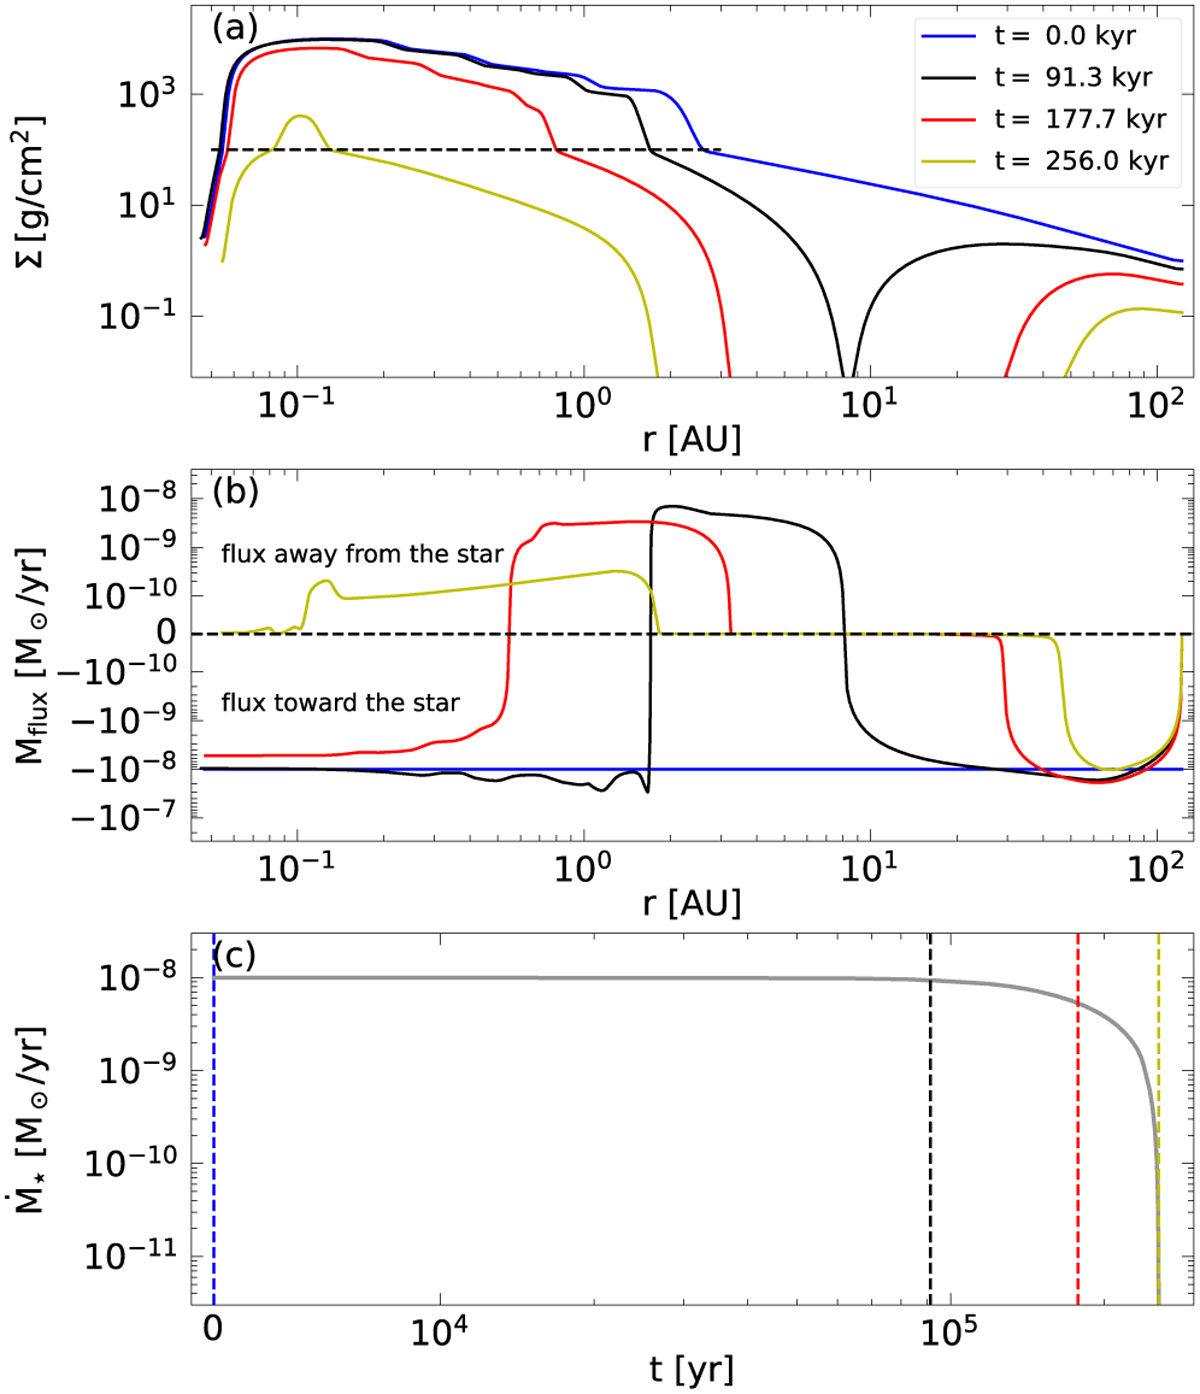
Exemplary evolution of our model. The X-ray luminosity of the star is Lx = 1031 erg s−1. Panel a shows the radial surface density profile, ∑(r), of four different timesteps. The initial model is shown as a blue line. From the opening of the gap (black line), we follow the evolution until the accretion rate on the star drops to zero (yellow line). The horizontal dashed line shows the surface layer density of ∑surf = 100 g cm−2. We assumed the presence of a dead zone if the surface density of the disk is larger than ∑surf. Panel b shows the mass flux within the disk for each timestep. A negative value denotes a flux towards the star, and a positive value corresponds to a mass flux away from the star. The horizontal dashed line shows the value of zero and divides the flux towards and away from the star. Panel c shows the evolution of the accretion rate, ![]() , over time. The coloured dashed vertical lines correspond to the respective surface density profile in Panel a.
, over time. The coloured dashed vertical lines correspond to the respective surface density profile in Panel a.
Current usage metrics show cumulative count of Article Views (full-text article views including HTML views, PDF and ePub downloads, according to the available data) and Abstracts Views on Vision4Press platform.
Data correspond to usage on the plateform after 2015. The current usage metrics is available 48-96 hours after online publication and is updated daily on week days.
Initial download of the metrics may take a while.