Fig. A.1
Download original image
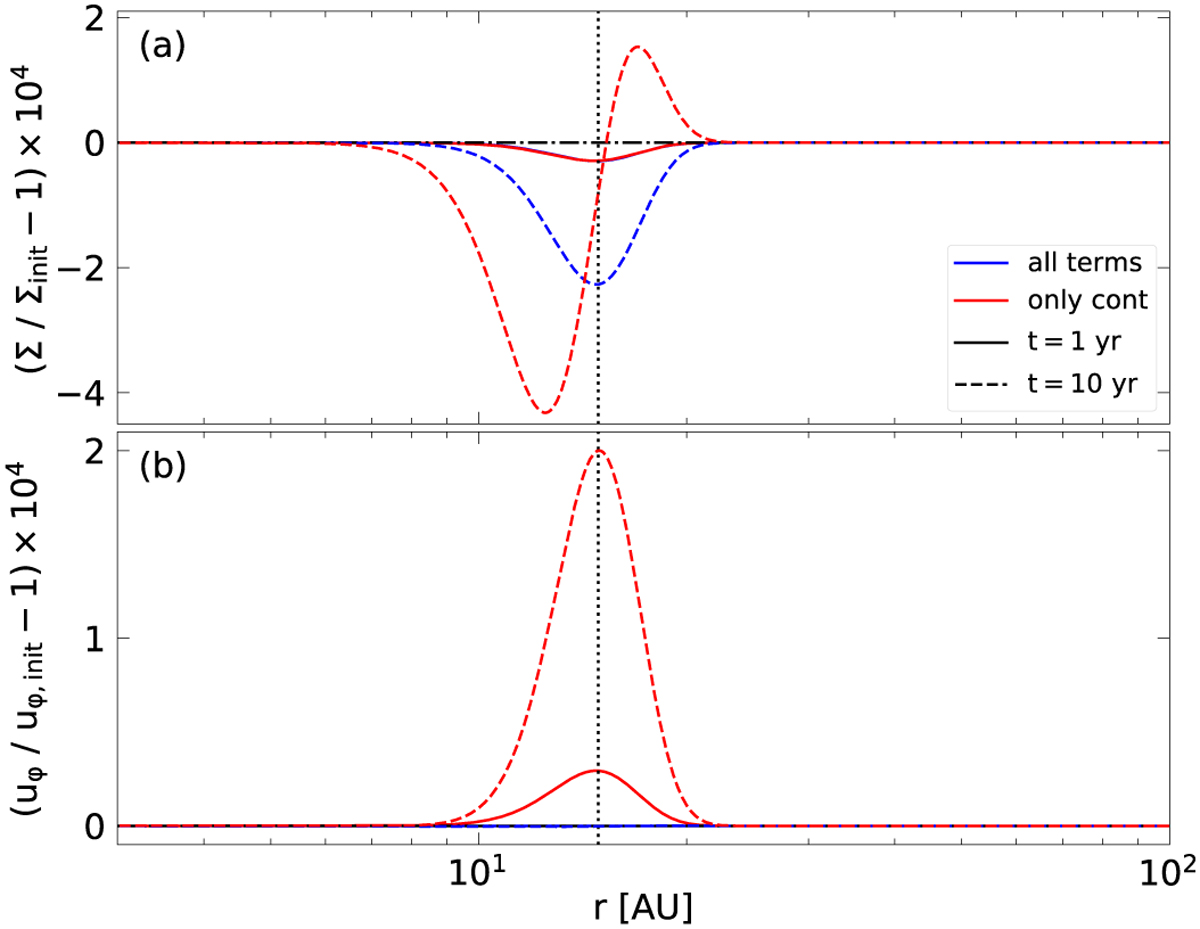
Visualisation of the importance of photoevaporative terms in the equation of motion. The relative change of the surface density profile (Panel a) and the azimuthal velocity (Panel b) are shown for two different cases of the initial model. The coloured lines represent models in which the photoevaporative terms are included in all equations (blue lines, model ‘all terms’) and only in the equation of continuity (red lines, model ‘only cont’), respectively. The solid and dashed lines show the relative changes one year and ten years after the photoevaporation has been enabled, respectively. No change compared to the initial model is indicated as a horizontal dash-dotted line at the value zero.
Current usage metrics show cumulative count of Article Views (full-text article views including HTML views, PDF and ePub downloads, according to the available data) and Abstracts Views on Vision4Press platform.
Data correspond to usage on the plateform after 2015. The current usage metrics is available 48-96 hours after online publication and is updated daily on week days.
Initial download of the metrics may take a while.