Fig. 7
Download original image
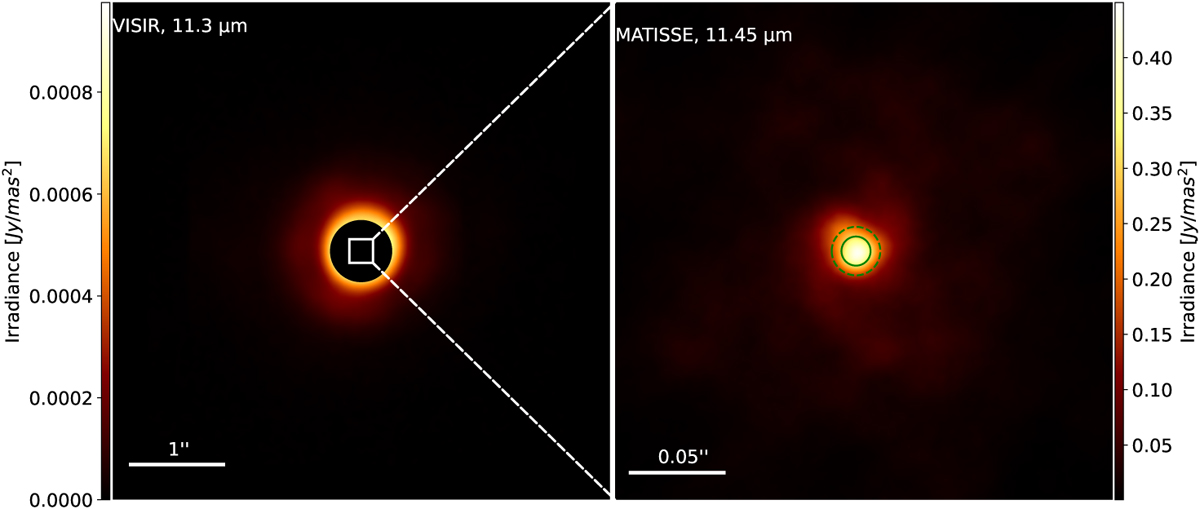
VISIR-MATISSE comparison. Left: the VISIR coronagraphic images. Right: the corresponding MATISSE-reconstructed image. The scale of the MATISSE field of view is represented by a white rectangle at the centre of the VISIR image. The green continuous circle represents the size of the stellar disc as measured in the K band while the green dashed circle is its interpolated value in the N band (see text). North is up, and east is left.
Current usage metrics show cumulative count of Article Views (full-text article views including HTML views, PDF and ePub downloads, according to the available data) and Abstracts Views on Vision4Press platform.
Data correspond to usage on the plateform after 2015. The current usage metrics is available 48-96 hours after online publication and is updated daily on week days.
Initial download of the metrics may take a while.