Fig. 5
Download original image
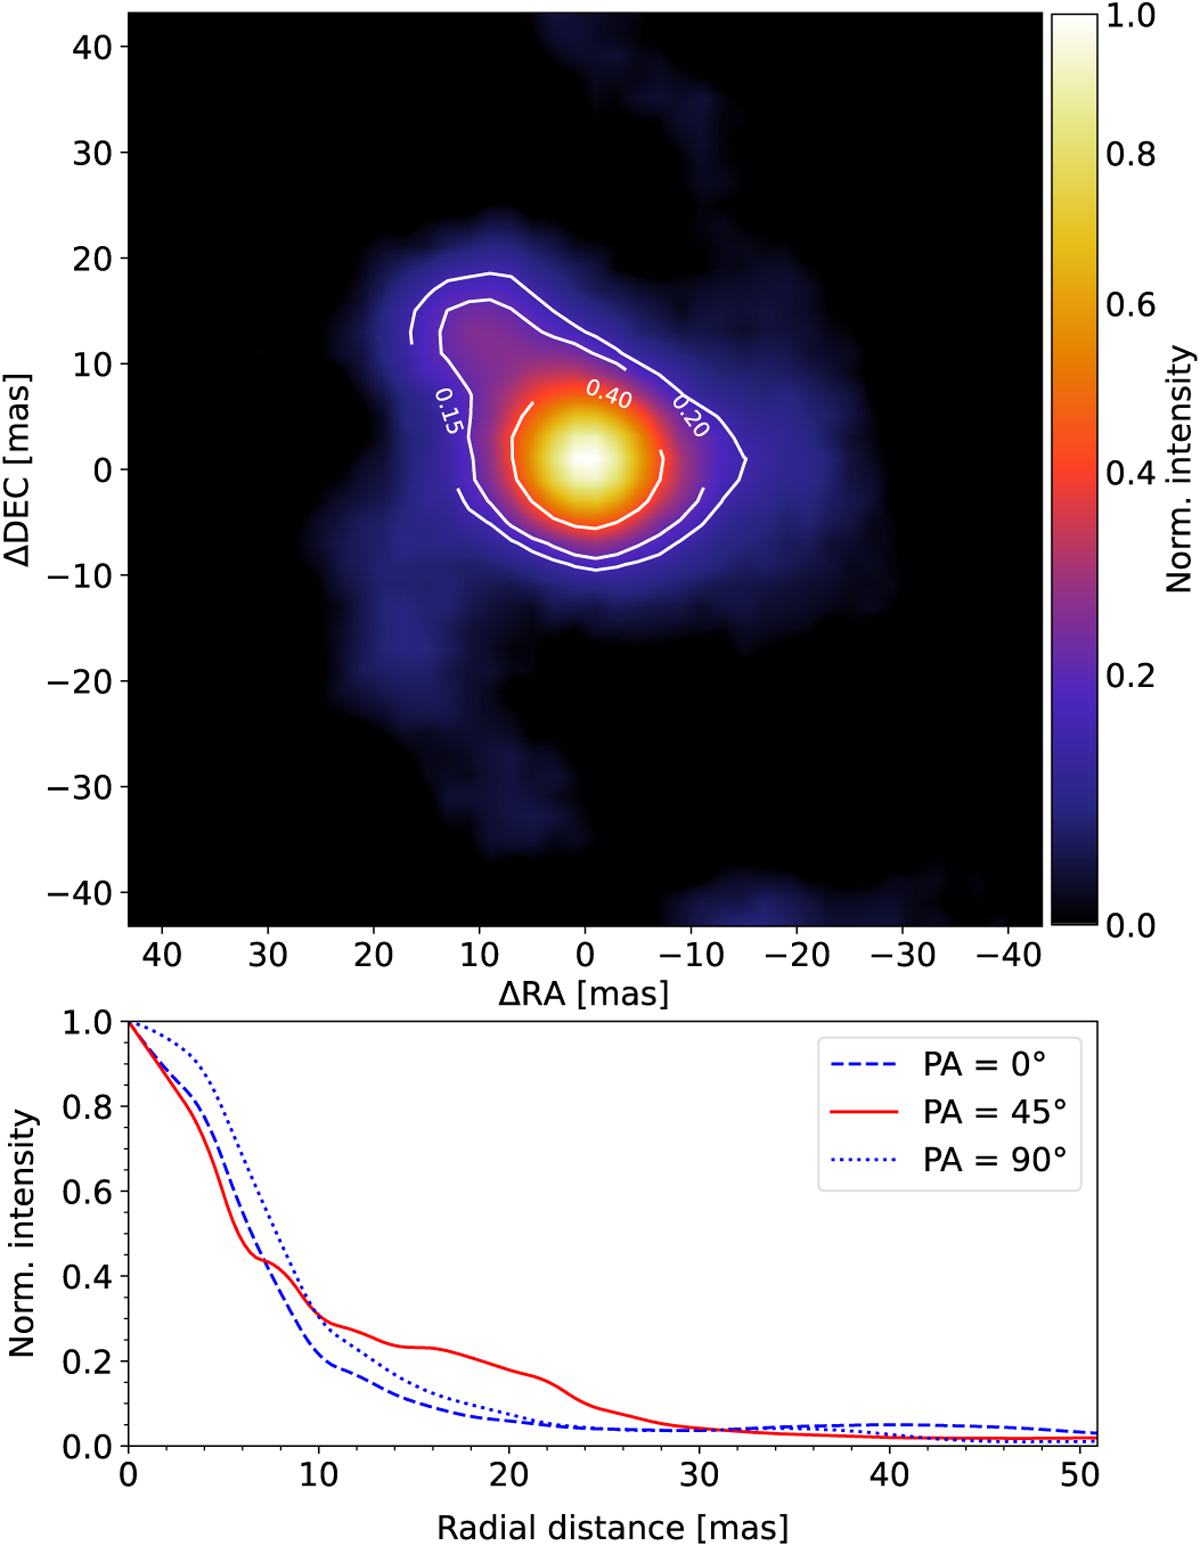
MATISSE image of V Hya for the spectral interval 10.50 –11.50 μm. Top: Image reconstructed with SQUEEZE. The white contour levels, labelled with the fraction of the peak intensity, highlight the elongation towards the upper left corner. In the text, this feature is referred to as the “20 mas extension”. Bottom: radial cuts (starting from the central brightest pixel) in the image for different PAs, as indicated.
Current usage metrics show cumulative count of Article Views (full-text article views including HTML views, PDF and ePub downloads, according to the available data) and Abstracts Views on Vision4Press platform.
Data correspond to usage on the plateform after 2015. The current usage metrics is available 48-96 hours after online publication and is updated daily on week days.
Initial download of the metrics may take a while.