Fig. 4
Download original image
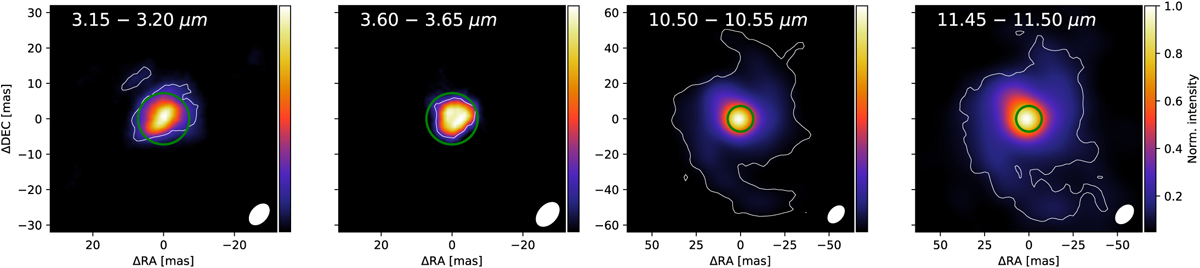
MATISSE images of V Hya reconstructed with SQUEEZE at four different spectral ranges across the L and N bands. The green circle represents the expected star diameter of 14.5 mas as measured in the K band (Millan-Gabet et al. 2003). The white contour is drawn at 3σ (as described in Appendix C). The white ellipse in the bottom right corner represents the mean synthesised primary beam.
Current usage metrics show cumulative count of Article Views (full-text article views including HTML views, PDF and ePub downloads, according to the available data) and Abstracts Views on Vision4Press platform.
Data correspond to usage on the plateform after 2015. The current usage metrics is available 48-96 hours after online publication and is updated daily on week days.
Initial download of the metrics may take a while.