Fig. 3
Download original image
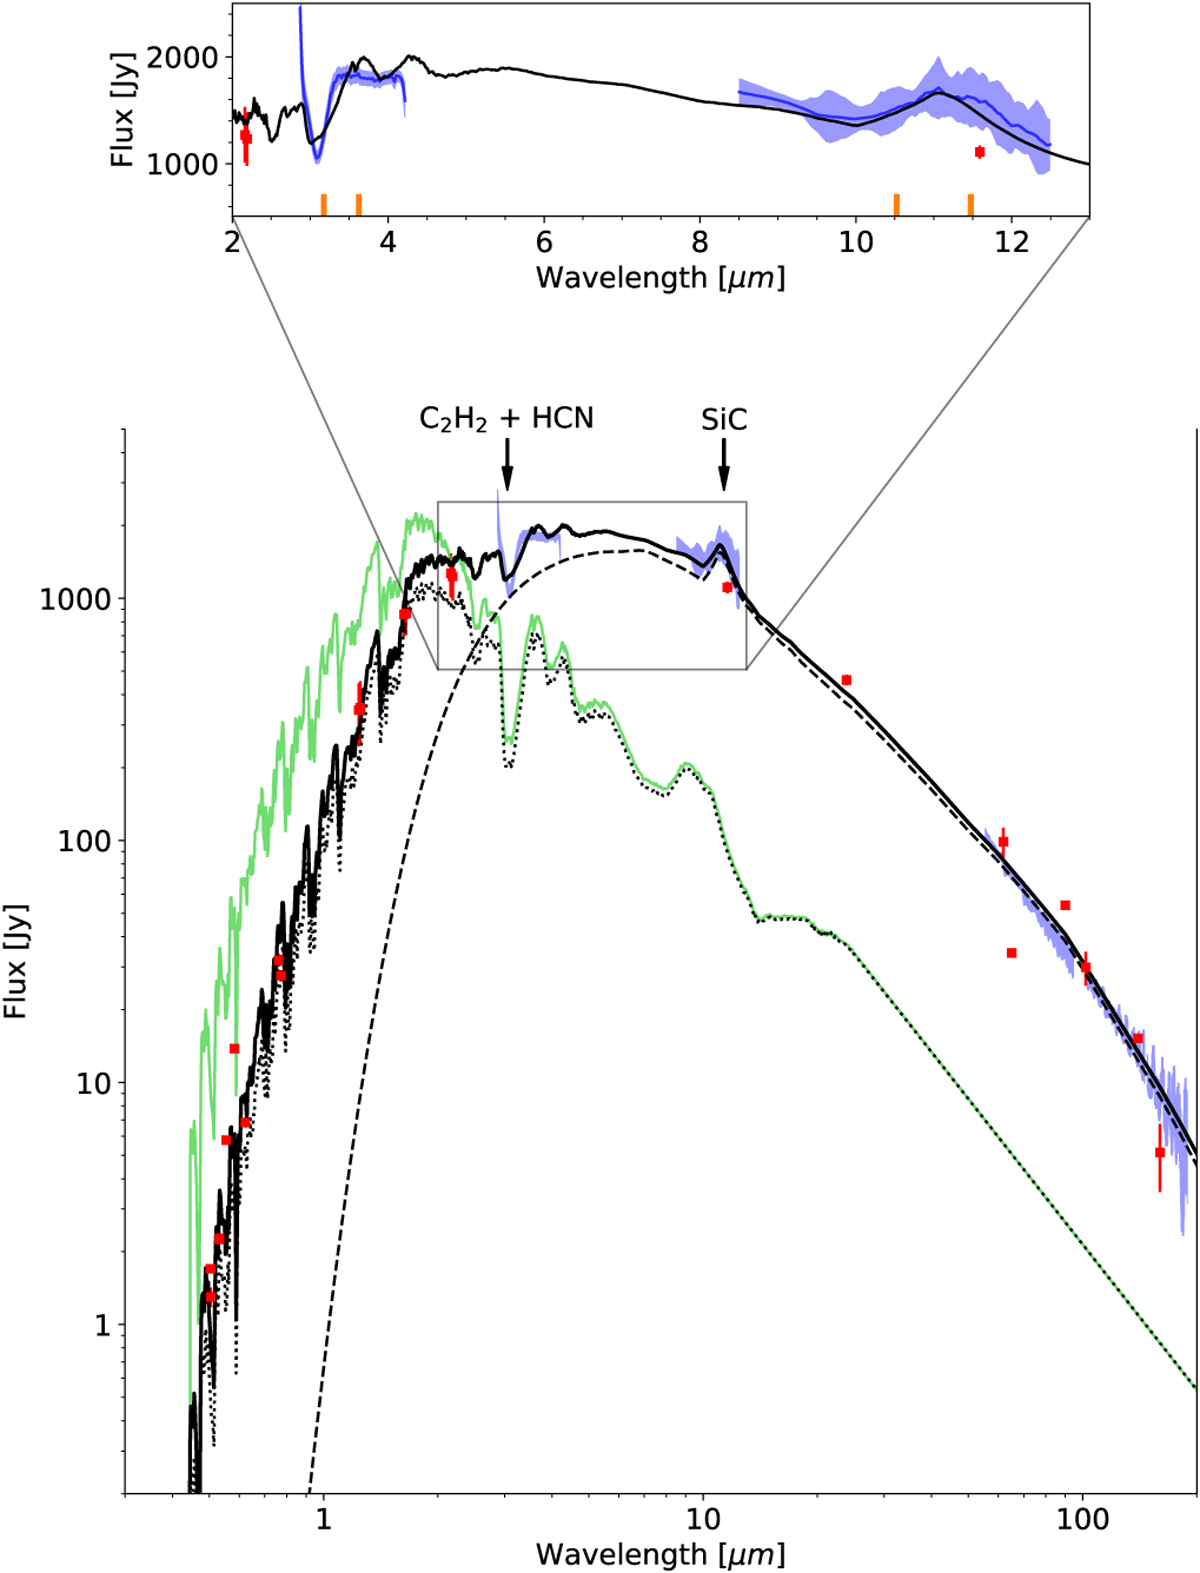
Spectral energy distribution of V Hya. The red dots represent the photometric data from Table E.1. The blue shades from left to right are, the MATISSE (L and N bands) and the HERSCHEL-PACS spectrum. The green line is the (unreddened) COMARCS stellar spectrum. The dotted line represents the reddened spectrum. The dashed line is the contribution of the dust emission and the thick black line represents the resulting DUSTY model. The inset zooms onto the MATISSE spectra. The vertical orange bars mark the wavelength region selected for image reconstruction.
Current usage metrics show cumulative count of Article Views (full-text article views including HTML views, PDF and ePub downloads, according to the available data) and Abstracts Views on Vision4Press platform.
Data correspond to usage on the plateform after 2015. The current usage metrics is available 48-96 hours after online publication and is updated daily on week days.
Initial download of the metrics may take a while.