Fig. D.1
Download original image
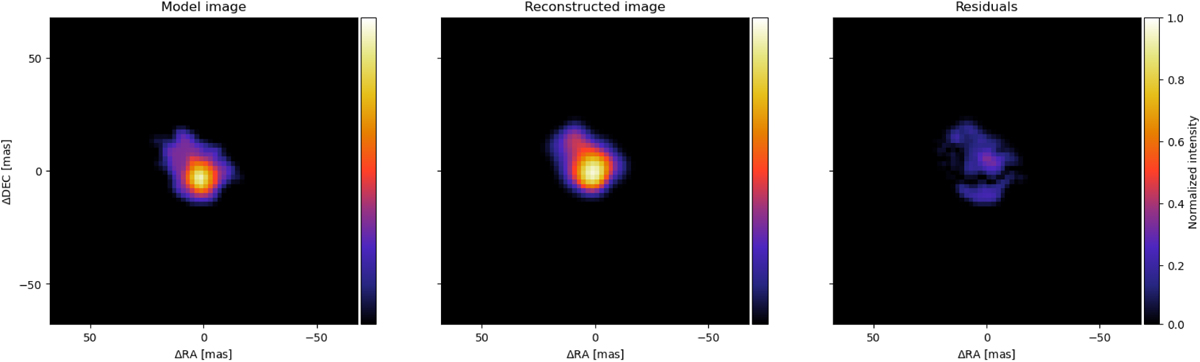
Estimate of the image noise level. Left: model image used to assess the reconstruction process. Centre: image reconstructed with the SQUEEZE reconstruction for the 11.45 μm range. Right: residual map. The root mean square of the map is 3.06% of the peak flux level of the original image. This sets the 3σ S/N threshold at 9.2 % in the reconstructed image.
Current usage metrics show cumulative count of Article Views (full-text article views including HTML views, PDF and ePub downloads, according to the available data) and Abstracts Views on Vision4Press platform.
Data correspond to usage on the plateform after 2015. The current usage metrics is available 48-96 hours after online publication and is updated daily on week days.
Initial download of the metrics may take a while.