Fig. C.1
Download original image
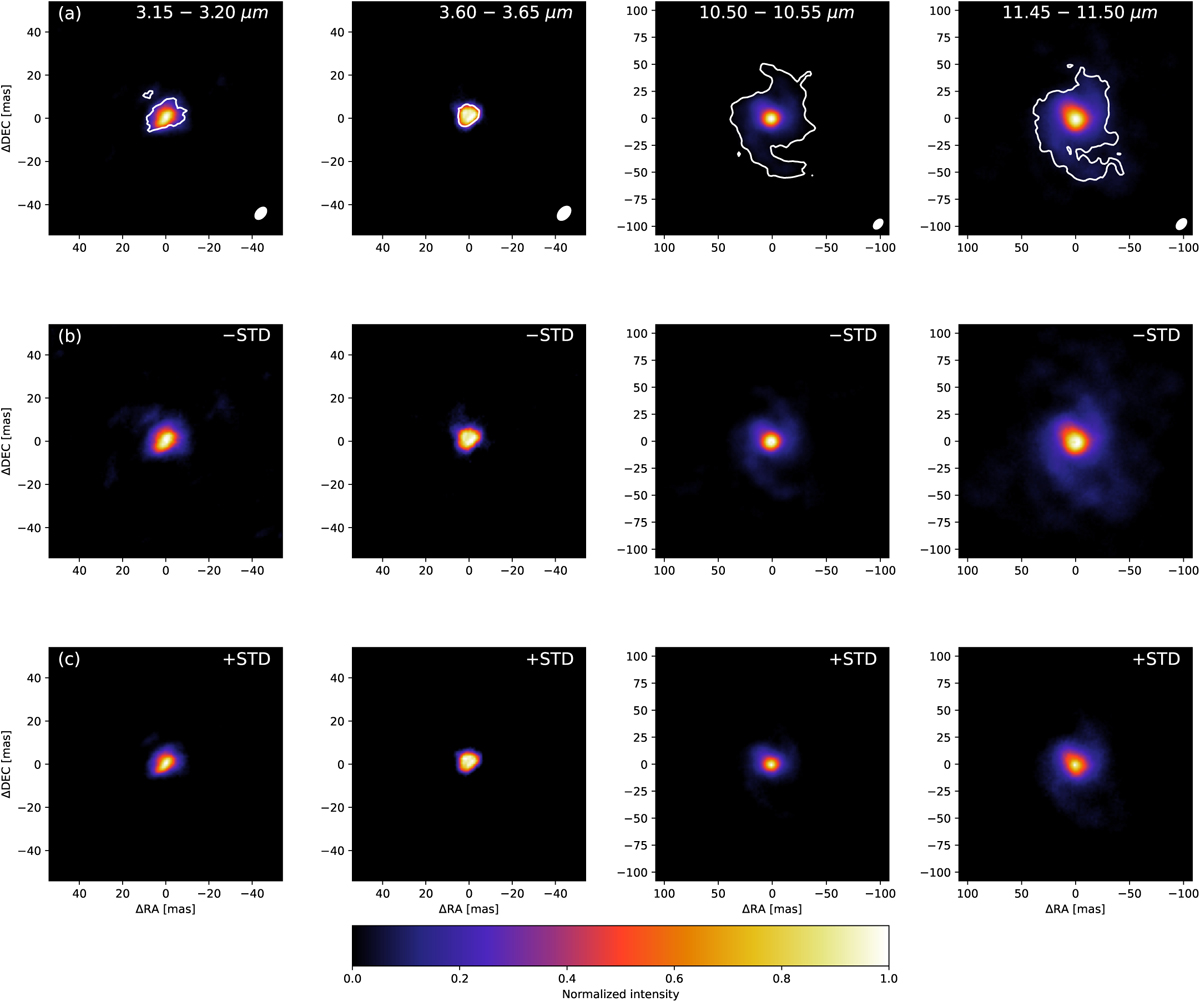
SQUEEZE-reconstructed images. (a) Mean image over the chains, (b) image one standard deviation below the mean image, and (c) image one standard deviation above the mean image. The ellipse in the bottom right corner represents the primary synthesised beam. In the upper panels, the white contours are drawn at the 3σ level, defined as three times the S/N threshold.
Current usage metrics show cumulative count of Article Views (full-text article views including HTML views, PDF and ePub downloads, according to the available data) and Abstracts Views on Vision4Press platform.
Data correspond to usage on the plateform after 2015. The current usage metrics is available 48-96 hours after online publication and is updated daily on week days.
Initial download of the metrics may take a while.