Open Access
Fig. 1
Download original image
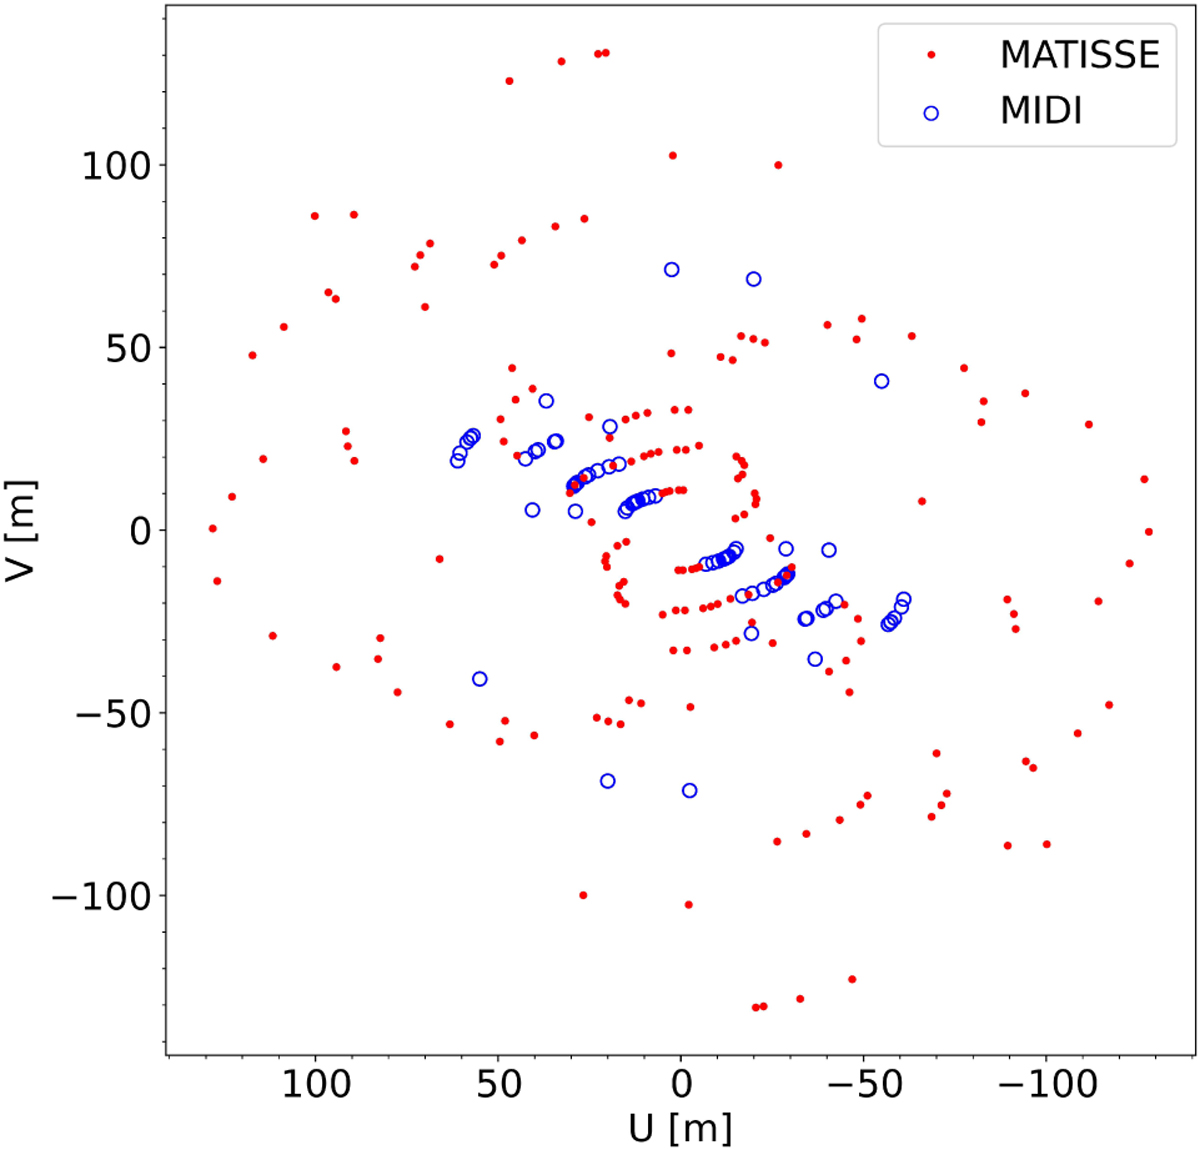
(u,v)-plane coverage of MATISSE (red dots) and MIDI observation (open blue circles). U and V represent the coordinates of the sky-projected baseline vectors (expressed in meters).
Current usage metrics show cumulative count of Article Views (full-text article views including HTML views, PDF and ePub downloads, according to the available data) and Abstracts Views on Vision4Press platform.
Data correspond to usage on the plateform after 2015. The current usage metrics is available 48-96 hours after online publication and is updated daily on week days.
Initial download of the metrics may take a while.