Open Access
Fig. A.2
Download original image
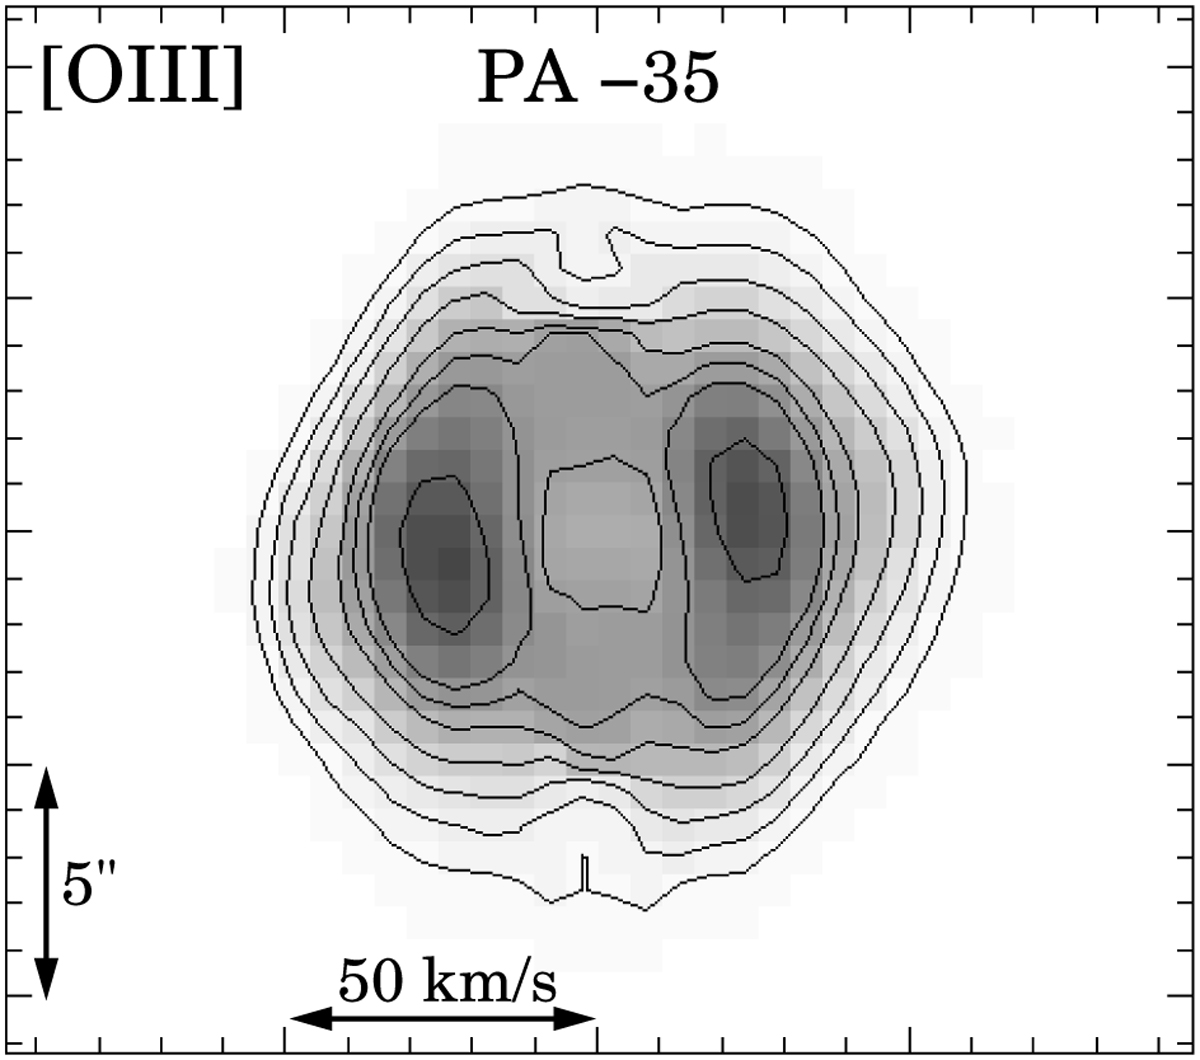
Gray scale and contour PV map of the [O III]λ5007 emission line at PA −35°. The contours are separated by a factor of two in linear intensity. Otherwise, the markings are the same as in Fig. 4.
Current usage metrics show cumulative count of Article Views (full-text article views including HTML views, PDF and ePub downloads, according to the available data) and Abstracts Views on Vision4Press platform.
Data correspond to usage on the plateform after 2015. The current usage metrics is available 48-96 hours after online publication and is updated daily on week days.
Initial download of the metrics may take a while.