Fig. A.1
Download original image
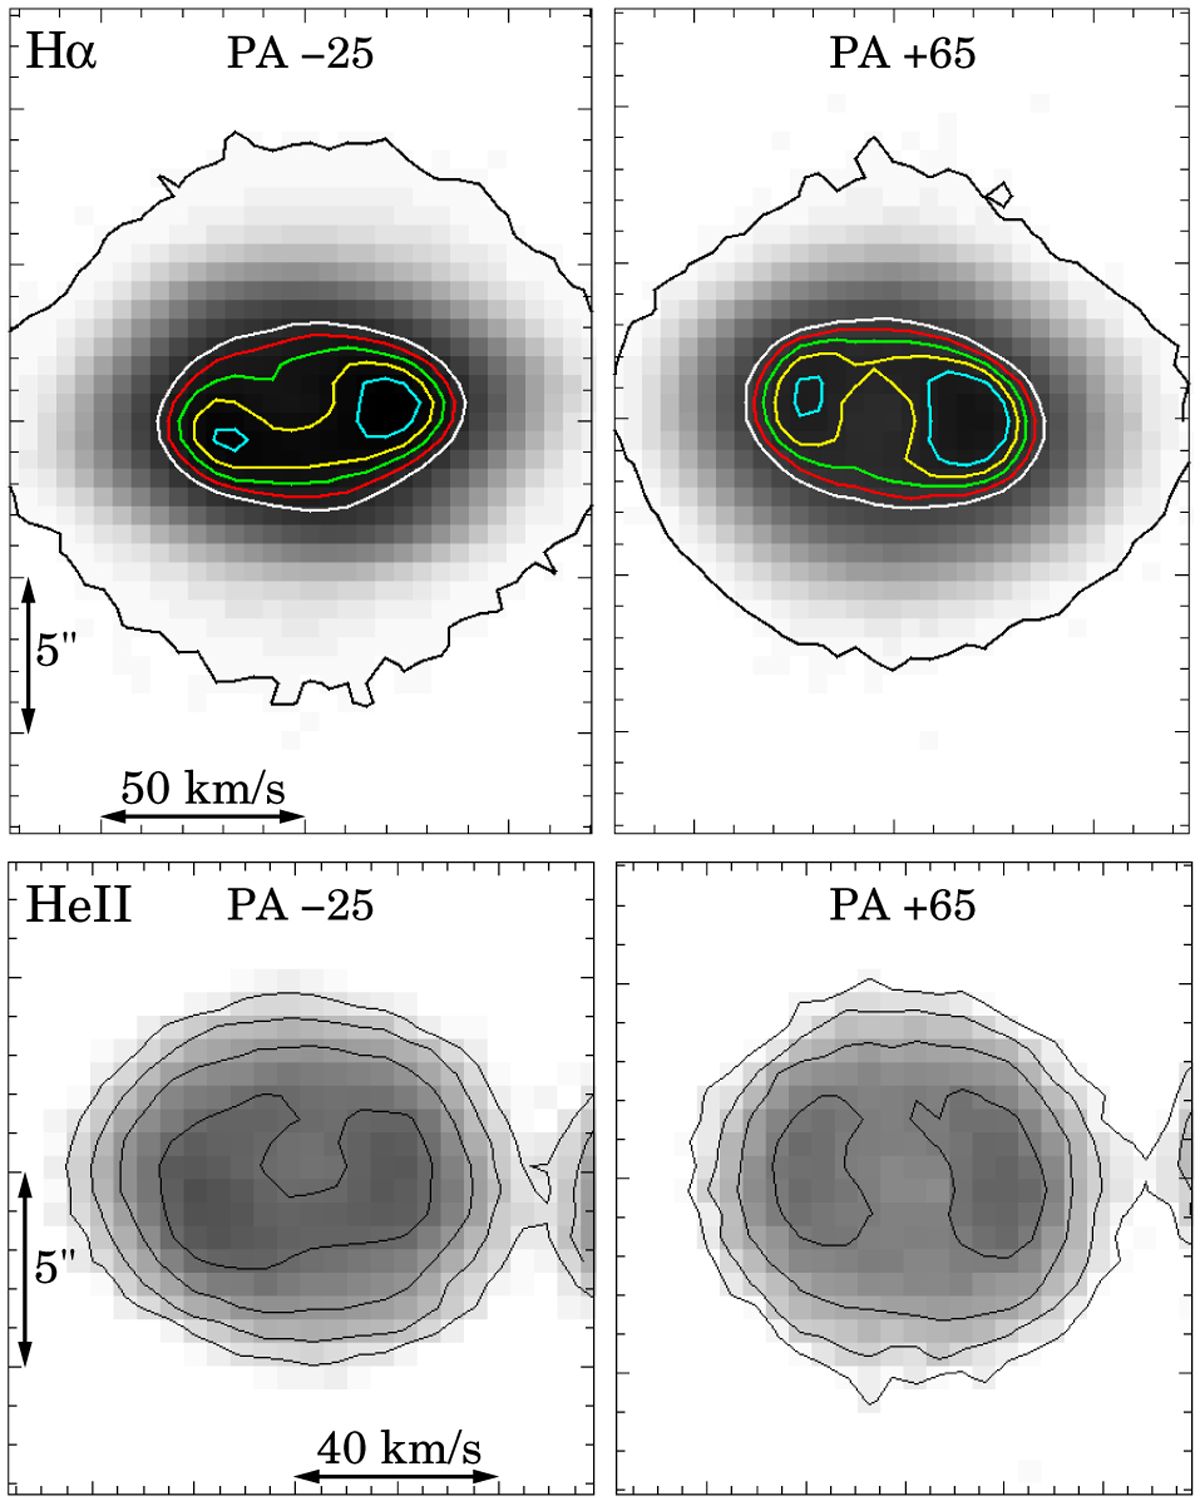
(Top) Gray scale and contour PV maps of the Hα emission line at PAs −25° and +65°. The contours represent increasing intensity following the color code: black, white, red, green, yellow, and cyan. The black contour is at ~5σ level from the background; the rest are arbitrary and have been chosen to show the spatio-kinematical structure of the brightest regions. (Bottom) Gray scale and contour PV maps of the He II·λ6560 emission line at PAs −25° and +65°. The contours are logarithmic and separated by a factor of two in linear intensity. The emission feature toward the right in the two panels is the Hα emission line. Otherwise, the markings are the same as in Fig. 4.
Current usage metrics show cumulative count of Article Views (full-text article views including HTML views, PDF and ePub downloads, according to the available data) and Abstracts Views on Vision4Press platform.
Data correspond to usage on the plateform after 2015. The current usage metrics is available 48-96 hours after online publication and is updated daily on week days.
Initial download of the metrics may take a while.