Fig. 6
Download original image
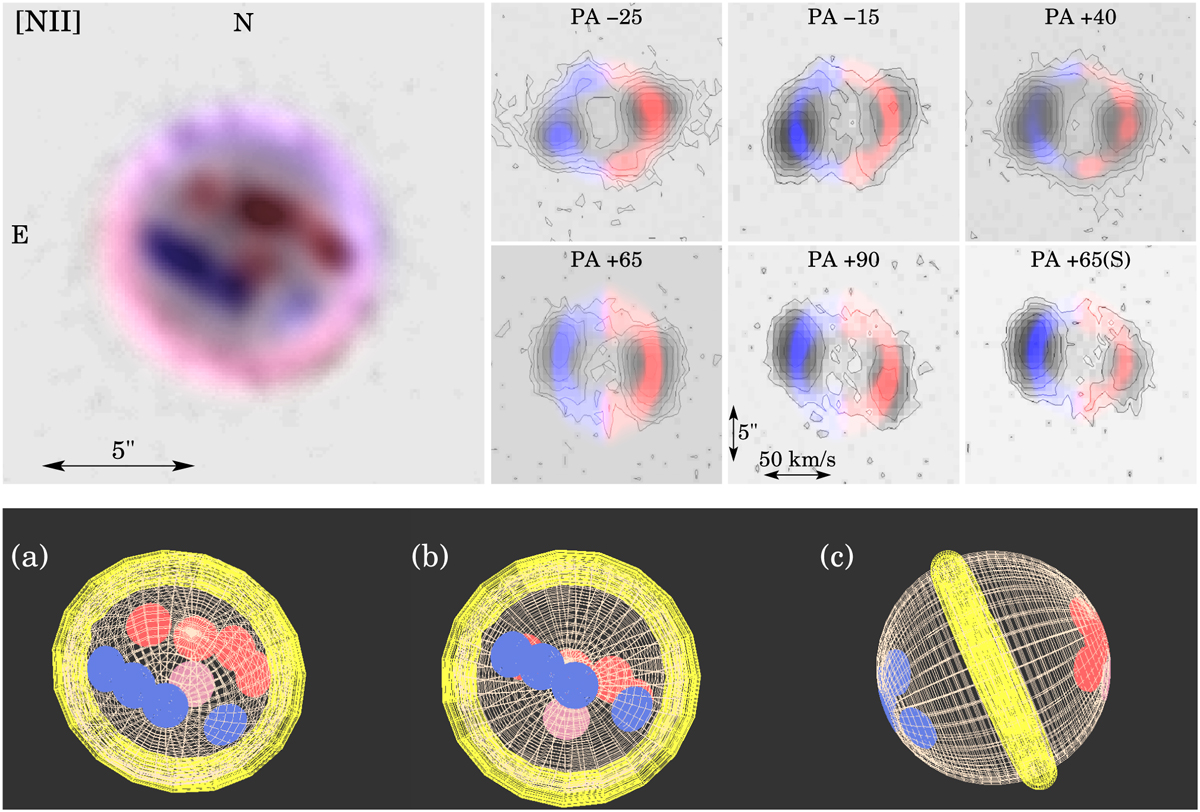
Top: Deconvolved image and PV maps of the [N II] emission line with the SHAPE reconstruction superimposd on top. Blue and red colors are used for regions that are blueshifted and redshifted, respectively, with respect to the systemic velocity. Otherwise, markings are the same as in Fig. 4 for the PV maps. Bottom: 3D views of our SHAPE reconstruction of Me 2-1: (a) from the observer; (b) pole-on; (c) side view. Yellow represents the equatorial ring, white the spheroidal shell, blue and red circles the caps or knots, and light red the knot at the center of the nebula (see text).
Current usage metrics show cumulative count of Article Views (full-text article views including HTML views, PDF and ePub downloads, according to the available data) and Abstracts Views on Vision4Press platform.
Data correspond to usage on the plateform after 2015. The current usage metrics is available 48-96 hours after online publication and is updated daily on week days.
Initial download of the metrics may take a while.