Fig. 4
Download original image
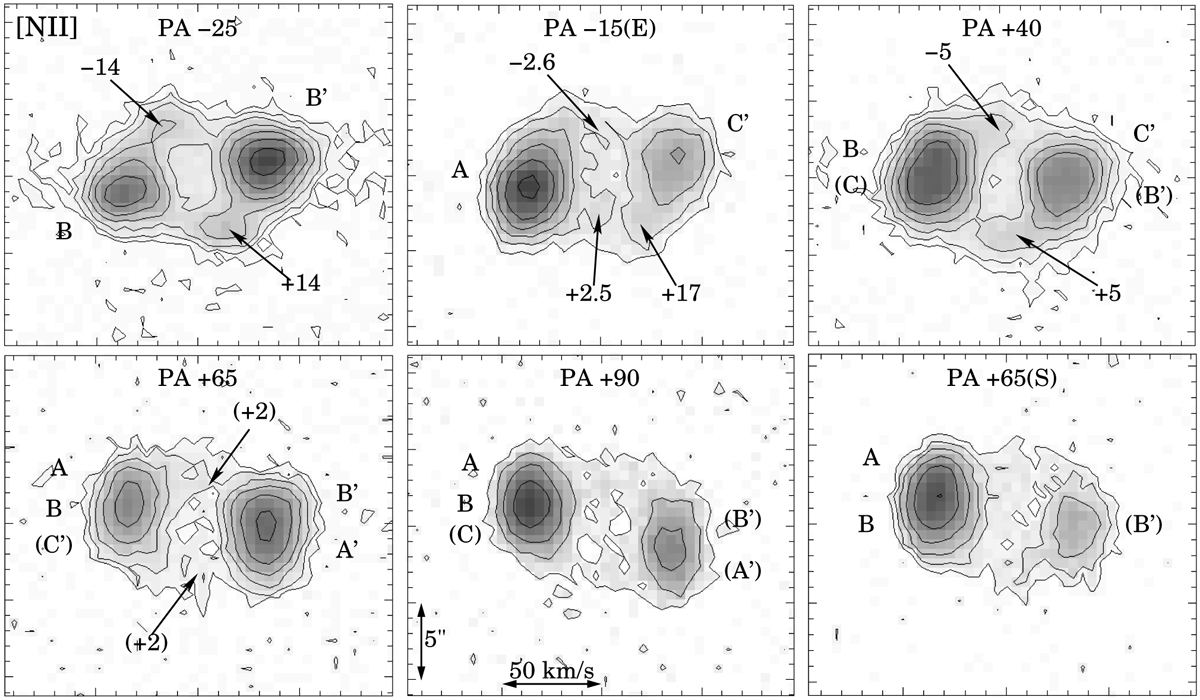
Gray scale and contour PV maps of the [N II]λ6583 emission line. The gray levels and contours are logarithmic, the latter separated by a factor of two in linear intensity. The PA of each PV map is indicated and its position in the PV map marks the orientation of the slit, in agreement with the orientations of the slits marked in Fig. 3. Spatial and radial velocity scales are indicated in the PV map at PA +90°. The letters indicate the knots that are mainly covered by each slit (see Fig. 1) and the numbers are radial velocities (km s−1) with respect to the systemic velocity of the nebula (Sect. 3.2).
Current usage metrics show cumulative count of Article Views (full-text article views including HTML views, PDF and ePub downloads, according to the available data) and Abstracts Views on Vision4Press platform.
Data correspond to usage on the plateform after 2015. The current usage metrics is available 48-96 hours after online publication and is updated daily on week days.
Initial download of the metrics may take a while.