Fig. 3
Download original image
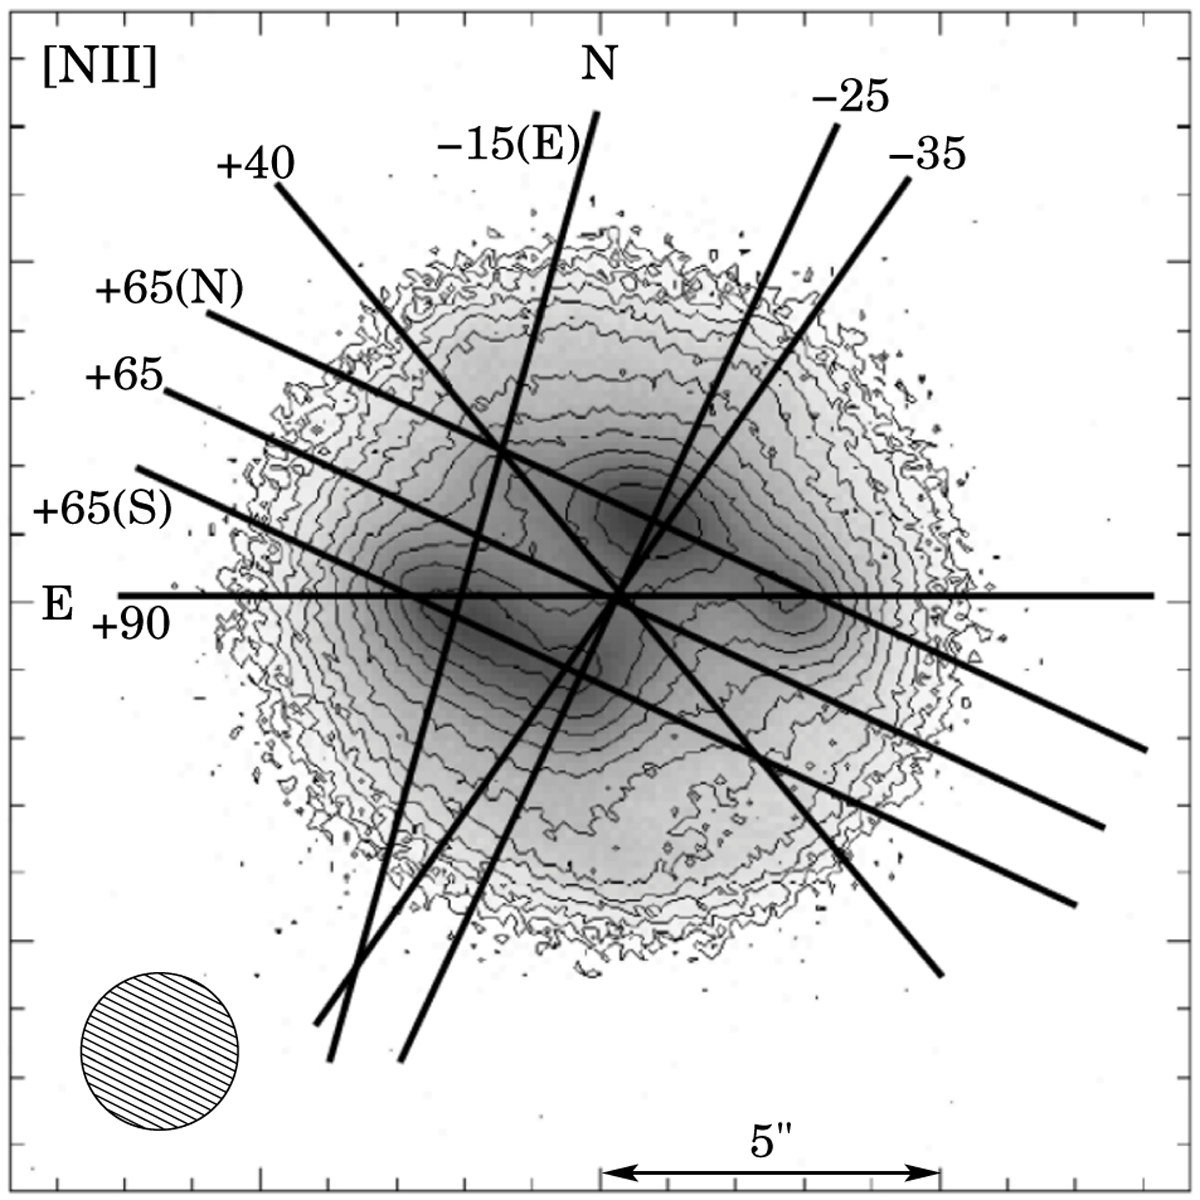
Positions of the slits used for high-resolution spectroscopy superimposed on a gray scale and contours reproduction of the [N II] image of Me 2-1. The slits are labeled by their PA (see the text and Table 2 for such details as, e.g., slit width). A long-slit at PA −25° was also used for the intermediate-resolution spectra (see Sect. 2.3). The scale and orientation of the image are indicated. The dashed circle represents the mean seeing in the long-slit spectra (see Table 2).
Current usage metrics show cumulative count of Article Views (full-text article views including HTML views, PDF and ePub downloads, according to the available data) and Abstracts Views on Vision4Press platform.
Data correspond to usage on the plateform after 2015. The current usage metrics is available 48-96 hours after online publication and is updated daily on week days.
Initial download of the metrics may take a while.