Fig. 1
Download original image
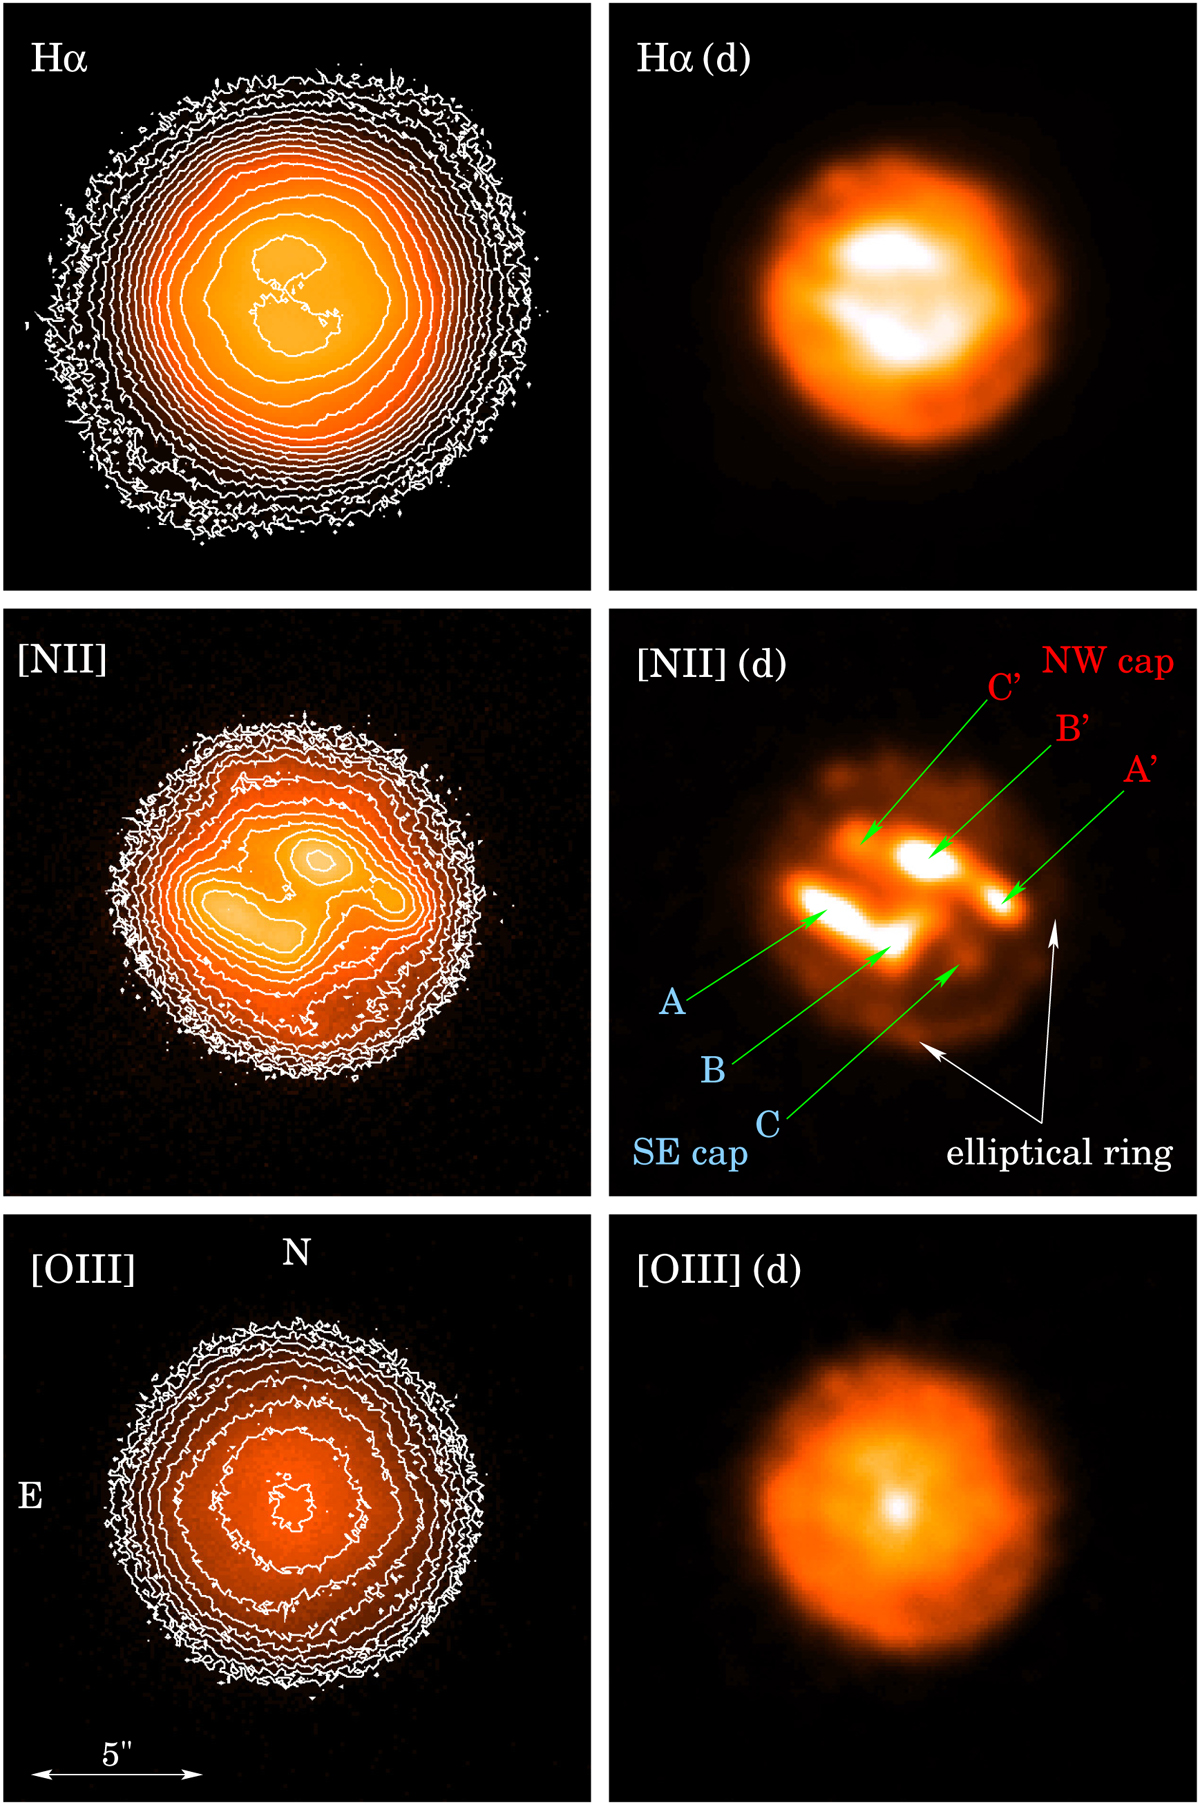
Narrow-band Hα, [N II], and [O III] images of Me 2-1. Left column: Original images. Intensity levels and contours are logarithmic. Contours are separated by a factor of 21/2 in linear intensity. Right column: Deconvolved images denoted with (d) after the filter’s name. Intensity levels are linear. The elliptical ring, the SE and NW caps, and the PS knots in the caps (see text) are labeled in the [N II](d) image. For the labels of the caps and bright knots, blue and red colors are used for blueshifted and redshifted features with respect to the systemic velocity of the nebula. Orientation and spatial scale are identical in the six panels and indicated in the [O III] image (bottom left).
Current usage metrics show cumulative count of Article Views (full-text article views including HTML views, PDF and ePub downloads, according to the available data) and Abstracts Views on Vision4Press platform.
Data correspond to usage on the plateform after 2015. The current usage metrics is available 48-96 hours after online publication and is updated daily on week days.
Initial download of the metrics may take a while.